8.2 创建时序图
8.2.1 概述
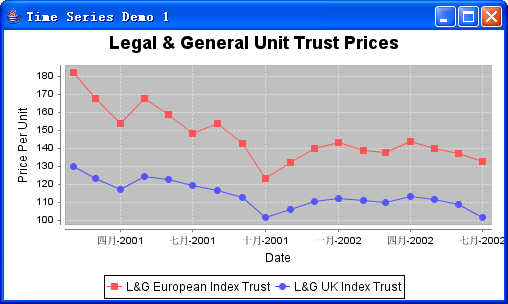
时序图表的确是一个使用XYDataset数据集的折线图。不同点就是再主轴上X轴值显示的是日期。本章讲述的一个简单应用如下图8.1所示

图8.1 一个简单的时序图表(参考:TimeSeriesDemo1.java)。
上图实例代码参见类TimeSeriesDemo1.java。
8.2.2 日期还是数字?
创建序图使用的数据集是XYDataset。接口不能有返回日期类型以外的方法。那么JFreeChart是如何创建时序图表的呢?
数据集返回的x值是基本的double类型,但这个值通过一种特殊的方式来进行转译成日期——该数是反映了一个从1970/1/1起计算的一个毫秒级值(译码过程使用java.util.Data类计算)。
具体的轴类(DateAxis)将毫秒级数据转化成日期,并作为需要返回该值,将数值作为主轴刻度显示出来。
8.2.3 数据集
演示的本实例,数据使用的是一个TimeSeriesCollection对象(我们可以是任何XYDataset接口的实现)。代码如下:
private static XYDataset createDataset() {
    TimeSeries timeseries = new TimeSeries(
        "L&G European Index Trust",
        (class$org$jfree$data$time$Month == null ? (class$org$jfree$data$time$Month = class$("org.jfree.data.time.Month"))
        : class$org$jfree$data$time$Month));
    timeseries.add(new Month(2, 2001), 181.8);
    timeseries.add(new Month(3, 2001), 167.3);
    timeseries.add(new Month(4, 2001), 153.8);
    timeseries.add(new Month(5, 2001), 167.6);
    timeseries.add(new Month(6, 2001), 158.8);
    timeseries.add(new Month(7, 2001), 148.3);
    timeseries.add(new Month(8, 2001), 153.9);
    timeseries.add(new Month(9, 2001), 142.7);
    timeseries.add(new Month(10, 2001), 123.2);
    timeseries.add(new Month(11, 2001), 131.8);
    timeseries.add(new Month(12, 2001), 139.6);
    timeseries.add(new Month(1, 2002), 142.9);
    timeseries.add(new Month(2, 2002), 138.7);
    timeseries.add(new Month(3, 2002), 137.3);
    timeseries.add(new Month(4, 2002), 143.9);
    timeseries.add(new Month(5, 2002), 139.8);
    timeseries.add(new Month(6, 2002), 137.0);
    timeseries.add(new Month(7, 2002), 132.8);
    TimeSeries timeseries_0_ = new TimeSeries(
        "L&G UK Index Trust",
        (class$org$jfree$data$time$Month == null ? (class$org$jfree$data$time$Month = class$("org.jfree.data.time.Month"))
        : class$org$jfree$data$time$Month));
    timeseries_0_.add(new Month(2, 2001), 129.6);
    timeseries_0_.add(new Month(3, 2001), 123.2);
    timeseries_0_.add(new Month(4, 2001), 117.2);
    timeseries_0_.add(new Month(5, 2001), 124.1);
    timeseries_0_.add(new Month(6, 2001), 122.6);
    timeseries_0_.add(new Month(7, 2001), 119.2);
    timeseries_0_.add(new Month(8, 2001), 116.5);
    timeseries_0_.add(new Month(9, 2001), 112.7);
    timeseries_0_.add(new Month(10, 2001), 101.5);
    timeseries_0_.add(new Month(11, 2001), 106.1);
    timeseries_0_.add(new Month(12, 2001), 110.3);
    timeseries_0_.add(new Month(1, 2002), 111.7);
    timeseries_0_.add(new Month(2, 2002), 111.0);
    timeseries_0_.add(new Month(3, 2002), 109.6);
    timeseries_0_.add(new Month(4, 2002), 113.2);
    timeseries_0_.add(new Month(5, 2002), 111.6);
    timeseries_0_.add(new Month(6, 2002), 108.8);
    timeseries_0_.add(new Month(7, 2002), 101.6);
    TimeSeriesCollection timeseriescollection = new TimeSeriesCollection();
    timeseriescollection.addSeries(timeseries);
    timeseriescollection.addSeries(timeseries_0_);
    return timeseriescollection;
}
实例中,系列包含了每月的数据。尽管如此,仍然使用TimeSeries类来显示间隔的时间值(年、日、小时等)。
8.2.4 构建图表
使用ChartFactory类提供的便利方法createTimeSeriesChart()创建图表,代码如下:
JFreeChart jfreechart = ChartFactory.createTimeSeriesChart(
    "Legal & General Unit Trust Prices", // title
    "Date", // x-axis label
    "Price Per Unit", // y-axis label
    xydataset, // data
    true, // create legend?
    true, // generate tooltips?
    false // generate URLs?
);
该方法构建了一个带有标题、图例、相应轴的区域和展示器的JFreeChart对象。使用的数据集见上一节内容。
8.2.5 定制图表
图表的大部分属性使用了缺省的值进行初始化。当然,我们可以随时修改这些属性的设置来改变我们图表的外观展现。在本实例中,修改的几个属性如下:
- 修改renderer,改变每个数据点显示的系列形状,数据点之间的折线除外。
- 主轴的数据格式进行格式化后显示。
修改renderer需要一下两个步骤:获得renderer引用和将renderer对象转化成XYLineAndShapeRenderer类型。代码如下:
XYItemRenderer xyitemrenderer = xyplot.getRenderer();
if (xyitemrenderer instanceof XYLineAndShapeRenderer) {
    XYLineAndShapeRenderer xylineandshaperenderer = (XYLineAndShapeRenderer) xyitemrenderer;
    xylineandshaperenderer.setBaseShapesVisible(true);
    xylineandshaperenderer.setBaseShapesFilled(true);
}
最后,将格式化的数据传给主轴,以改变显示。代码如下:
DateAxis dateaxis = (DateAxis) xyplot.getDomainAxis();
dateaxis.setDateFormatOverride(new SimpleDateFormat("MMM-yyyy"));
当设置了Dataaxis时,系统将自动选择一个DataTickUnit来显示主轴刻度。但系统将使用上面我们格式化的数据来显示,而不是系统默认的格式。
8.2.6 全部代码
文档的全部代码如下:
/* TimeSeriesDemo1 - Decompiled by JODE
* Visit http://jode.sourceforge.net/
*/
package demo;
import java.awt.Color;
import java.awt.Dimension;
import java.text.SimpleDateFormat;
import javax.swing.JPanel;
import org.jfree.chart.ChartFactory;
import org.jfree.chart.ChartPanel;
import org.jfree.chart.JFreeChart;
import org.jfree.chart.axis.DateAxis;
import org.jfree.chart.plot.XYPlot;
import org.jfree.chart.renderer.xy.XYLineAndShapeRenderer;
import org.jfree.data.time.Month;
import org.jfree.data.time.TimeSeries;
import org.jfree.data.time.TimeSeriesCollection;
import org.jfree.data.xy.XYDataset;
import org.jfree.ui.ApplicationFrame;
import org.jfree.ui.RectangleInsets;
import org.jfree.ui.RefineryUtilities;
public class TimeSeriesDemo1 extends ApplicationFrame {
    private static final long serialVersionUID = -5412286370956646368L;
    /* synthetic */
    static Class class$org$jfree$data$time$Month;
    public TimeSeriesDemo1(String string) {
        super(string);
        XYDataset xydataset = createDataset();
        JFreeChart jfreechart = createChart(xydataset);
        ChartPanel chartpanel = new ChartPanel(jfreechart, false);
        chartpanel.setPreferredSize(new Dimension(500, 270));
        chartpanel.setMouseZoomable(true, false);
        setContentPane(chartpanel);
    }
    private static JFreeChart createChart(XYDataset xydataset) {
        JFreeChart jfreechart = ChartFactory.createTimeSeriesChart(
            "Legal & General Unit Trust Prices", // title
            "Date", // x-axis label
            "Price Per Unit", // y-axis label
            xydataset, // data
            true, // create legend?
            true, // generate tooltips?
            false // generate URLs?
        );
        jfreechart.setBackgroundPaint(Color.white);
        XYPlot xyplot = (XYPlot) jfreechart.getPlot();
        xyplot.setBackgroundPaint(Color.lightGray);
        xyplot.setDomainGridlinePaint(Color.white);
        xyplot.setRangeGridlinePaint(Color.white);
        xyplot.setAxisOffset(new RectangleInsets(5.0, 5.0, 5.0, 5.0));
        xyplot.setDomainCrosshairVisible(true);
        xyplot.setRangeCrosshairVisible(true);
        org.jfree.chart.renderer.xy.XYItemRenderer xyitemrenderer = xyplot
            .getRenderer();
        if (xyitemrenderer instanceof XYLineAndShapeRenderer) {
            XYLineAndShapeRenderer xylineandshaperenderer = (XYLineAndShapeRenderer) xyitemrenderer;
            xylineandshaperenderer.setBaseShapesVisible(true);
            xylineandshaperenderer.setBaseShapesFilled(true);
        }
        DateAxis dateaxis = (DateAxis) xyplot.getDomainAxis();
        dateaxis.setDateFormatOverride(new SimpleDateFormat("MMM-yyyy"));
        return jfreechart;
    }
    private static XYDataset createDataset() {
        TimeSeries timeseries = new TimeSeries(
            "L&G European Index Trust",
            (class$org$jfree$data$time$Month == null ? (class$org$jfree$data$time$Month = class$("org.jfree.data.time.Month"))
            : class$org$jfree$data$time$Month));
        timeseries.add(new Month(2, 2001), 181.8);
        timeseries.add(new Month(3, 2001), 167.3);
        timeseries.add(new Month(4, 2001), 153.8);
        timeseries.add(new Month(5, 2001), 167.6);
        timeseries.add(new Month(6, 2001), 158.8);
        timeseries.add(new Month(7, 2001), 148.3);
        timeseries.add(new Month(8, 2001), 153.9);
        timeseries.add(new Month(9, 2001), 142.7);
        timeseries.add(new Month(10, 2001), 123.2);
        timeseries.add(new Month(11, 2001), 131.8);
        timeseries.add(new Month(12, 2001), 139.6);
        timeseries.add(new Month(1, 2002), 142.9);
        timeseries.add(new Month(2, 2002), 138.7);
        timeseries.add(new Month(3, 2002), 137.3);
        timeseries.add(new Month(4, 2002), 143.9);
        timeseries.add(new Month(5, 2002), 139.8);
        timeseries.add(new Month(6, 2002), 137.0);
        timeseries.add(new Month(7, 2002), 132.8);
        TimeSeries timeseries_0_ = new TimeSeries(
            "L&G UK Index Trust",
            (class$org$jfree$data$time$Month == null ? (class$org$jfree$data$time$Month = class$("org.jfree.data.time.Month"))
            : class$org$jfree$data$time$Month));
        timeseries_0_.add(new Month(2, 2001), 129.6);
        timeseries_0_.add(new Month(3, 2001), 123.2);
        timeseries_0_.add(new Month(4, 2001), 117.2);
        timeseries_0_.add(new Month(5, 2001), 124.1);
        timeseries_0_.add(new Month(6, 2001), 122.6);
        timeseries_0_.add(new Month(7, 2001), 119.2);
        timeseries_0_.add(new Month(8, 2001), 116.5);
        timeseries_0_.add(new Month(9, 2001), 112.7);
        timeseries_0_.add(new Month(10, 2001), 101.5);
        timeseries_0_.add(new Month(11, 2001), 106.1);
        timeseries_0_.add(new Month(12, 2001), 110.3);
        timeseries_0_.add(new Month(1, 2002), 111.7);
        timeseries_0_.add(new Month(2, 2002), 111.0);
        timeseries_0_.add(new Month(3, 2002), 109.6);
        timeseries_0_.add(new Month(4, 2002), 113.2);
        timeseries_0_.add(new Month(5, 2002), 111.6);
        timeseries_0_.add(new Month(6, 2002), 108.8);
        timeseries_0_.add(new Month(7, 2002), 101.6);
        TimeSeriesCollection timeseriescollection = new TimeSeriesCollection();
        timeseriescollection.addSeries(timeseries);
        timeseriescollection.addSeries(timeseries_0_);
        return timeseriescollection;
    }
    public static JPanel createDemoPanel() {
        JFreeChart jfreechart = createChart(createDataset());
        return new ChartPanel(jfreechart);
    }
    public static void main$(String[] strings) {
        TimeSeriesDemo1 timeseriesdemo1 = new TimeSeriesDemo1(
            "Time Series Demo 1");
        timeseriesdemo1.pack();
        RefineryUtilities.centerFrameOnScreen(timeseriesdemo1);
        timeseriesdemo1.setVisible(true);
    }
    public static void main(String[] args) {
        main$(args);
    }
    /* synthetic */
    static Class class$(String string) {
        Class var_class;
        try {
            var_class = Class.forName(string);
        } catch (ClassNotFoundException classnotfoundexception) {
            throw new NoClassDefFoundError(classnotfoundexception.getMessage());
        }
        return var_class;
    }
}