SVG 图形 Example
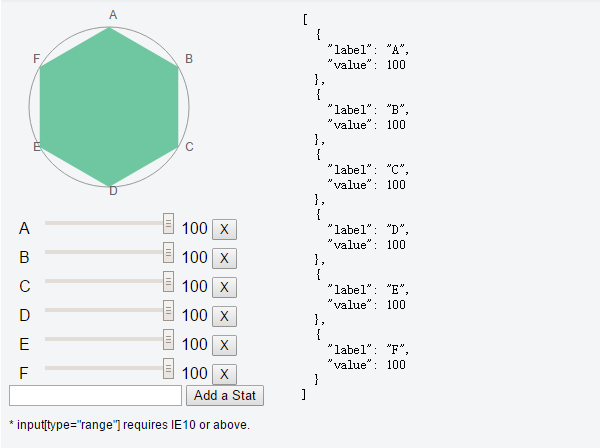
这个例子演示了综合使用自定义组件、计算属性、双向绑定及 SVG 支持。
html
<!-- template for the polygraph component. -->
<script type="text/x-template" id="polygraph-template">
  <g>
    <polygon :points="points"></polygon>
    <circle cx="100" cy="100" r="80"></circle>
    <axis-label
      v-for="stat in stats"
      :stat="stat"
      :index="$index"
      :total="stats.length">
    </axis-label>
  </g>
</script>

<!-- template for the axis label component. -->
<script type="text/x-template" id="axis-label-template">
  <text :x="point.x" :y="point.y">{{stat.label}}</text>
</script>

<!-- demo root element -->
<div id="demo">
  <!-- Use the component -->
  <svg width="200" height="200">
    <polygraph :stats="stats"></polygraph>
  </svg>
  <!-- controls -->
  <div v-for="stat in stats">
    <label>{{stat.label}}</label>
    <input type="range" v-model="stat.value" min="0" max="100">
    <span>{{stat.value}}</span>
    <button @click="remove(stat)">X</button>
  </div>
  <form id="add">
    <input name="newlabel" v-model="newLabel">
    <button @click="add">Add a Stat</button>
  </form>
  <pre id="raw">{{stats | json}}</pre>
</div>

<p style="font-size:12px">* input[type="range"] requires IE10 or above.</p>
js
// The raw data to observe
var stats = [
  { label: 'A', value: 100 },
  { label: 'B', value: 100 },
  { label: 'C', value: 100 },
  { label: 'D', value: 100 },
  { label: 'E', value: 100 },
  { label: 'F', value: 100 }
]

// A resusable polygon graph component
Vue.component('polygraph', {
  props: ['stats'],
  template: '#polygraph-template',
  replace: true,
  computed: {
    // a computed property for the polygon's points
    points: function () {
      var total = this.stats.length
      return this.stats.map(function (stat, i) {
        var point = valueToPoint(stat.value, i, total)
        return point.x + ',' + point.y
      }).join(' ')
    }
  },
  components: {
    // a sub component for the labels
    'axis-label': {
      props: {
        stat: Object,
        index: Number,
        total: Number
      },
      template: '#axis-label-template',
      replace: true,
      computed: {
        point: function () {
          return valueToPoint(
            +this.stat.value + 10,
            this.index,
            this.total
          )
        }
      }
    }
  }
})

// math helper...
function valueToPoint (value, index, total) {
  var x     = 0
  var y     = -value * 0.8
  var angle = Math.PI * 2 / total * index
  var cos   = Math.cos(angle)
  var sin   = Math.sin(angle)
  var tx    = x * cos - y * sin + 100
  var ty    = x * sin + y * cos + 100
  return {
    x: tx,
    y: ty
  }
}

// bootstrap the demo
new Vue({
  el: '#demo',
  data: {
    newLabel: '',
    stats: stats
  },
  methods: {
    add: function (e) {
      e.preventDefault()
      if (!this.newLabel) return
      this.stats.push({
        label: this.newLabel,
        value: 100
      })
      this.newLabel = ''
    },
    remove: function (stat) {
      if (this.stats.length > 3) {
        this.stats.$remove(stat)
      } else {
        alert('Can\'t delete more!')
      }
    }
  }
})
css
body {
    font-family: Helvetica Neue, Arial, sans-serif;
}

polygon {
    fill: #42b983;
    opacity: .75;
}

circle {
    fill: transparent;
    stroke: #999;
}

text {
    font-family: Helvetica Neue, Arial, sans-serif;
    font-size: 10px;
    fill: #666;
}

label {
    display: inline-block;
    margin-left: 10px;
    width: 20px;
}

#raw {
    position: absolute;
    top: 0;
    left: 300px;
}