设计自己的Trait编辑器
在前面的章节中我们知道,每种trait属性都对应有缺省的trait编辑器,如果在View中不指定编辑器的话,将使用缺省的编辑器构成界面。每个编辑器都可以对应有多个后台,目前支持的后台界面库有pyQt和wxPython。每种编辑器都可以有四种样式:simple, custom, text, readonly。
traitsUI为我们提供了很丰富的编辑器库,以至于我们很少有自己设计编辑器的需求,然而如果我们能方便地设计自己的编辑器,将能制作出更加专业的程序界面。
本章节将简要介绍trait编辑器的工作原理;并且制作一个新的trait编辑器,用以显示matplotlib提供的绘图控件;然后以此控件制作一个通用的绘制CSV文件数据图像的小工具。
Trait编辑器的工作原理
我们先来看下面这个小程序,它定义了一个TestStrEditor类,其中有一个名为test的trait属性,其类型为Str,在view中用Item定义要在界面中显示test属性,但是没有指定它所使用的编辑器(通过editor参数)。当执行t.configure_traits()时,traits库将自动为我们挑选文本编辑框控件作为test属性的编辑器:
from enthought.traits.api import *
from enthought.traits.ui.api import *

class TestStrEditor(HasTraits):
    test = Str
    view = View(Item("test"))

t = TestStrEditor()
t.configure_traits()
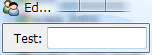
使用文本编辑框控件编辑test属性
Traits库的路径
下面的介绍需要查看traits库的源程序,因此首先你需要知道它们在哪里:
traits: site-packages\Traits-3.2.0-py2.6-win32.egg\enthought\traits, 以下简称 %traits%
traitsUI: site-packages\Traits-3.2.0-py2.6-win32.egg\enthought\traits\UI, 以下简称 %ui%
wx后台界面库: site-packages\TraitsBackendWX-3.2.0-py2.6.egg\enthought\traitsui\wx, 以下简称 %wx%
Str对象的缺省编辑器通过其create_editor方法获得:
>>> from enthought.traits.api import *
>>> s = Str()
>>> ed = s.create_editor()
>>> type(ed)
<class 'enthought.traits.ui.editors.text_editor.ToolkitEditorFactory'>
>>> ed.get()
{'auto_set': True,
 'custom_editor_class': <class 'enthought.traits.ui.wx.text_editor.CustomEditor'>,
 'enabled': True,
 'enter_set': False,
 'evaluate': <enthought.traits.ui.editors.text_editor._Identity object at 0x0427F1B0>,
 'evaluate_name': '',
 'format_func': None,
 'format_str': '',
 'invalid': '',
 'is_grid_cell': False,
 'mapping': {},
 'multi_line': True,
 'password': False,
 'readonly_editor_class': <class 'enthought.traits.ui.wx.text_editor.ReadonlyEditor'>,
 'simple_editor_class': <class 'enthought.traits.ui.wx.text_editor.SimpleEditor'>,
 'text_editor_class': <class 'enthought.traits.ui.wx.text_editor.SimpleEditor'>,
 'view': None}
create_editor方法的源代码可以在%traits%trait_types.py中的BaseStr类的定义中找到。create_editor方法得到的是一个text_editor.ToolkitEditorFactory类:
enthought.traits.ui.editors.text_editor.ToolkitEditorFactory
在%ui%editorstext_editor.py中你可以找到它的定义,它继承于EditorFactory类。EditorFactory类的代码在%ui%editor_factory.py中。EditorFactory类是Traits编辑器的核心,通过它和后台界面库联系起来。让我们来详细看看EditorFactory类中关于控件生成方面的代码:
class EditorFactory ( HasPrivateTraits ):
    # 下面四个属性描述四个类型的编辑器的类
    simple_editor_class = Property
    custom_editor_class = Property
    text_editor_class   = Property
    readonly_editor_class = Property

    # 用simple_editor_class创建实际的控件
    def simple_editor ( self, ui, object, name, description, parent ):
        return self.simple_editor_class( parent,
                                         factory     = self,
                                         ui          = ui,
                                         object      = object,
                                         name        = name,
                                         description = description )

    # 这是类的方法,它通过类的以及父类自动找到与其匹配的后台界面库中的控件类
    @classmethod
    def _get_toolkit_editor(cls, class_name):
        editor_factory_classes = [factory_class for factory_class in cls.mro()
                                  if issubclass(factory_class, EditorFactory)]
        for index in range(len( editor_factory_classes )):
            try:
                factory_class = editor_factory_classes[index]
                editor_file_name = os.path.basename(
                                sys.modules[factory_class.__module__].__file__)
                return toolkit_object(':'.join([editor_file_name.split('.')[0],
                                             class_name]), True)
            except Exception, e:
                if index == len(editor_factory_classes)-1:
                    raise e
        return None

    # simple_editor_class属性的get方法,获取属性值
    def _get_simple_editor_class(self):
        try:
            SimpleEditor = self._get_toolkit_editor('SimpleEditor')
        except:
            SimpleEditor = toolkit_object('editor_factory:SimpleEditor')
        return SimpleEditor
EditorFactory的对象有四个属性保存后台编辑器控件的类:simple_editor_class, custom_editor_class, text_editor_class, readonly_editor_class。例如前面例子中的ed对象的simple_editor_class为<class 'enthought.traits.ui.wx.text_editor.SimpleEditor'>,我们看到它用的是wx后台界面库中的text_editor中的SimpleEditor类,稍后我们将看看其内容。
EditorFactory是通过其类方法_get_toolkit_editor计算出所要用后台界面库中的类的。由于_get_toolkit_editor是类方法,它的第一个参数cls就是类本身。当调用text_editor.ToolkitEditorFactory._get_toolkit_editor()时,cls就是text_editor.ToolkitEditorFactory类。通过调用cls.mro获得cls以及其所有父类,然后一个一个地查找,从后台界面库中找到与之匹配的类,这个工作由toolkit_object函数完成。其源代码可以在%ui%toolkit.py中找到。
因为后台界面库中的类的组织结构和traits.ui是一样的,因此不需要额外的配置文件,只需要几个字符串替代操作就可以将traits.ui中的EditorFactory类和后台界面库中的实际的编辑器类联系起来。下图显示了traits.ui中的EditorFactory和后台界面库的关系。
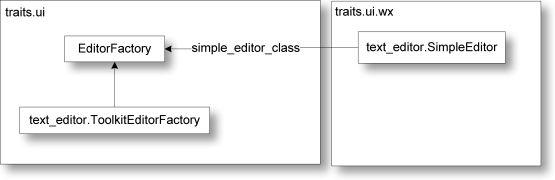
traits.ui中的EditorFactory和后台界面库的关系
wx后台界面库中定义了所有编辑器控件,在 %wx%text_editor.py 中你可以找到产生文本框控件的类 text_editor.SimpleEditor。类名表示了控件的样式:simple, custom, text, readonly,而其文件名(模块名)则表示了控件的类型。下面是 text_editor.SimpleEditor的部分代码:
class SimpleEditor ( Editor ):

    # Flag for window styles:
    base_style = 0

    # Background color when input is OK:
    ok_color = OKColor

    # Function used to evaluate textual user input:
    evaluate = evaluate_trait

    def init ( self, parent ):
        """ Finishes initializing the editor by creating the underlying toolkit
 widget.
 """
        factory       = self.factory
        style         = self.base_style
        self.evaluate = factory.evaluate
        self.sync_value( factory.evaluate_name, 'evaluate', 'from' )

        if (not factory.multi_line) or factory.password:
            style &= ~wx.TE_MULTILINE

        if factory.password:
            style |= wx.TE_PASSWORD

        multi_line = ((style & wx.TE_MULTILINE) != 0)
        if multi_line:
            self.scrollable = True

        if factory.enter_set and (not multi_line):
            control = wx.TextCtrl( parent, -1, self.str_value,
                                   style = style | wx.TE_PROCESS_ENTER )
            wx.EVT_TEXT_ENTER( parent, control.GetId(), self.update_object )
        else:
            control = wx.TextCtrl( parent, -1, self.str_value, style = style )

        wx.EVT_KILL_FOCUS( control, self.update_object )

        if factory.auto_set:
            wx.EVT_TEXT( parent, control.GetId(), self.update_object )

        self.control = control
        self.set_tooltip()
真正产生控件的程序是在init方法中,此方法在产生界面时自动被调用,注意方法名是init,不要和对象初始化方法__init__搞混淆了。
制作matplotlib的编辑器
Enthought的官方绘图库是采用Chaco,不过如果你对matplotlib库更加熟悉的话,将matplotlib的绘图控件嵌入TraitsUI界面中将是非常有用的。下面先来看一下嵌入matplotlib控件的完整源代码:
# -*- coding: utf-8 -*-
# file name: mpl_figure_editor.py
import wx
import matplotlib
# matplotlib采用WXAgg为后台,这样才能将绘图控件嵌入以wx为后台界面库的traitsUI窗口中
matplotlib.use("WXAgg")
from matplotlib.backends.backend_wxagg import FigureCanvasWxAgg as FigureCanvas
from matplotlib.backends.backend_wx import NavigationToolbar2Wx
from enthought.traits.ui.wx.editor import Editor
from enthought.traits.ui.basic_editor_factory import BasicEditorFactory

class _MPLFigureEditor(Editor):
    """
 相当于wx后台界面库中的编辑器,它负责创建真正的控件
 """
    scrollable = True

    def init(self, parent):
        self.control = self._create_canvas(parent)
        self.set_tooltip()
        print dir(self.item)

    def update_editor(self):
        pass

    def _create_canvas(self, parent):
        """
 创建一个Panel, 布局采用垂直排列的BoxSizer, panel中中添加
 FigureCanvas, NavigationToolbar2Wx, StaticText三个控件
 FigureCanvas的鼠标移动事件调用mousemoved函数,在StaticText
 显示鼠标所在的数据坐标
 """
        panel = wx.Panel(parent, -1, style=wx.CLIP_CHILDREN)
        def mousemoved(event):
            panel.info.SetLabel("%s, %s" % (event.xdata, event.ydata))
        panel.mousemoved = mousemoved
        sizer = wx.BoxSizer(wx.VERTICAL)
        panel.SetSizer(sizer)
        mpl_control = FigureCanvas(panel, -1, self.value)
        mpl_control.mpl_connect("motion_notify_event", mousemoved)
        toolbar = NavigationToolbar2Wx(mpl_control)
        sizer.Add(mpl_control, 1, wx.LEFT | wx.TOP | wx.GROW)
        sizer.Add(toolbar, 0, wx.EXPAND|wx.RIGHT)
        panel.info = wx.StaticText(parent, -1)
        sizer.Add(panel.info)

        self.value.canvas.SetMinSize((10,10))
        return panel

class MPLFigureEditor(BasicEditorFactory):
    """
 相当于traits.ui中的EditorFactory,它返回真正创建控件的类
 """
    klass = _MPLFigureEditor

if __name__ == "__main__":
    from matplotlib.figure import Figure
    from enthought.traits.api import HasTraits, Instance
    from enthought.traits.ui.api import View, Item
    from numpy import sin, cos, linspace, pi

    class Test(HasTraits):
        figure = Instance(Figure, ())
        view = View(
            Item("figure", editor=MPLFigureEditor(), show_label=False),
            width = 400,
            height = 300,
            resizable = True)
        def __init__(self):
            super(Test, self).__init__()
            axes = self.figure.add_subplot(111)
            t = linspace(0, 2*pi, 200)
            axes.plot(sin(t))

    Test().configure_traits()
此程序的运行结果如下:
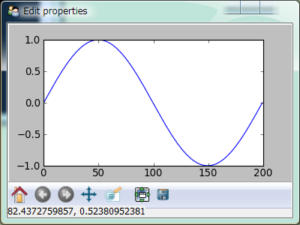
在TraitsUI界面中嵌入的matplotlib绘图控件
由于我们的编辑器没有simple等四种样式,也不会放到wx后台界面库的模块中,因此不能采用上节所介绍的自动查找编辑器类的办法。traits.ui为我们提供一个一个方便的类来完成这些操作:BasicEditorFactory。它的源程序可以在 %ui%basic_editor_factory.py中找到。下面是其中的一部分:
class BasicEditorFactory ( EditorFactory ):
    klass = Any

    def _get_simple_editor_class ( self ):
        return self.klass
    ...
它通过重载EditorFactory中的simple_editor_class属性,直接返回创建控件的库klass。MPLFigureEditor继承于BasicEditorFactory,指定创建控件的类为_MPLFigureEditor。
和text_editor.SimpleEditor一样,从Editor类继承,在_MPLFigureEditor类的init方法中,创建实际的控件。因为Editor类中有一个update_editor方法,在其对应的trait属性改变是会被调用,而我们的绘图控件不需要这个功能,所以重载update_editor,让它不做任何事情。
matplotlib中,在创建FigureCanvas时需要指定与其对应的Figure对象:
mpl_control = FigureCanvas(panel, -1, self.value)
这里self.value就是这个Figure对象,它在MVC的模型类Test中被定义为:
figure = Instance(Figure, ())
控件类可以通过self.value获得与其对应的模型类中的对象。因此_MPLFigureEditor中的self.value和Test类中的self.figure是同一个对象。
_create_canvas方法中的程序编写和在一个标准的wx窗口中添加控件是一样的,界面库相关的细节不是本书的重点,因此不再详细解释了。读者可以参照matplotlib和wxPython的相应文档。
CSV数据绘图工具
下面用前面介绍的matplotlib编辑器制作一个CSV数据绘图工具。用此工具打开一个CSV数据文档之后,可以绘制多个X-Y坐标图。用户可以自由地添加新的坐标图,修改坐标图的标题,选择坐标图的X轴和Y轴的数据。
下面是此程序的界面截图:

CSV数据绘图工具的界面
图中以标签页的形式显示多个绘图,用户可以从左侧的数据选择栏中选择X轴和Y轴的数据。标签页可以自由的拖动,构成上下左右分栏,并且可以隐藏左侧的数据选择栏:
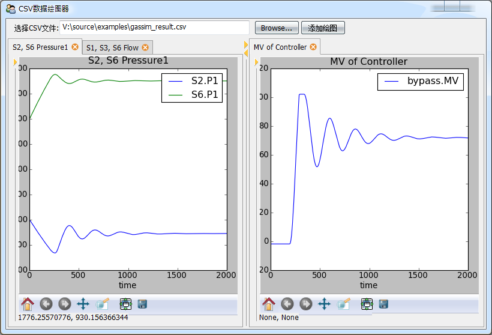
使用可调整DOCK的多标签页界面方便用户对比数据
由于绘图控件是matplotlib所提供的,因此平移、缩放、保存文件等功能也一应俱全。由于所有的界面都是采用TraitsUI设计的,因此主窗口既可以用来单独显示,也可以嵌入到一个更大的界面中,运用十分灵活。
下面是完整的源程序,运行时需要和mpl_figure_editor.py放在一个文件夹下。包括注释程序一共约170行,编写时间少于一小时。
# -*- coding: utf-8 -*-
from matplotlib.figure import Figure
from mpl_figure_editor import MPLFigureEditor
from enthought.traits.ui.api import *
from enthought.traits.api import *
import csv

class DataSource(HasTraits):
    """
 数据源,data是一个字典,将字符串映射到列表
 names是data中的所有字符串的列表
 """
    data = DictStrAny
    names = List(Str)

    def load_csv(self, filename):
        """
 从CSV文件读入数据,更新data和names属性
 """
        f = file(filename)
        reader = csv.DictReader(f)
        self.names = reader.fieldnames
        for field in reader.fieldnames:
            self.data[field] = []
        for line in reader:
            for k, v in line.iteritems():
                self.data[k].append(float(v))
        f.close()

class Graph(HasTraits):
    """
 绘图组件,包括左边的数据选择控件和右边的绘图控件
 """
    name = Str # 绘图名,显示在标签页标题和绘图标题中
    data_source = Instance(DataSource) # 保存数据的数据源
    figure = Instance(Figure) # 控制绘图控件的Figure对象
    selected_xaxis = Str # X轴所用的数据名
    selected_items = List # Y轴所用的数据列表

    clear_button = Button(u"清除") # 快速清除Y轴的所有选择的数据

    view = View(
        HSplit( # HSplit分为左右两个区域,中间有可调节宽度比例的调节手柄
            # 左边为一个组
            VGroup(
                Item("name"),   # 绘图名编辑框
                Item("clear_button"), # 清除按钮
                Heading(u"X轴数据"),  # 静态文本
                # X轴选择器,用EnumEditor编辑器,即ComboBox控件,控件中的候选数据从
                # data_source的names属性得到
                Item("selected_xaxis", editor=
                    EnumEditor(name="object.data_source.names", format_str=u"%s")),
                Heading(u"Y轴数据"), # 静态文本
                # Y轴选择器,由于Y轴可以多选,因此用CheckBox列表编辑,按两列显示
                Item("selected_items", style="custom",
                     editor=CheckListEditor(name="object.data_source.names",
                            cols=2, format_str=u"%s")),
                show_border = True, # 显示组的边框
                scrollable = True,  # 组中的控件过多时,采用滚动条
                show_labels = False # 组中的所有控件都不显示标签
            ),
            # 右边绘图控件
            Item("figure", editor=MPLFigureEditor(), show_label=False, width=600)
        )
    )

    def _name_changed(self):
        """
 当绘图名发生变化时,更新绘图的标题
 """
        axe = self.figure.axes[0]
        axe.set_title(self.name)
        self.figure.canvas.draw()

    def _clear_button_fired(self):
        """
 清除按钮的事件处理
 """
        self.selected_items = []
        self.update()

    def _figure_default(self):
        """
 figure属性的缺省值,直接创建一个Figure对象
 """
        figure = Figure()
        figure.add_axes([0.05, 0.1, 0.9, 0.85]) #添加绘图区域,四周留有边距
        return figure

    def _selected_items_changed(self):
        """
 Y轴数据选择更新
 """
        self.update()

    def _selected_xaxis_changed(self):
        """
 X轴数据选择更新
 """
        self.update()

    def update(self):
        """
 重新绘制所有的曲线
 """
        axe = self.figure.axes[0]
        axe.clear()
        try:
            xdata = self.data_source.data[self.selected_xaxis]
        except:
            return
        for field in self.selected_items:
            axe.plot(xdata, self.data_source.data[field], label=field)
        axe.set_xlabel(self.selected_xaxis)
        axe.set_title(self.name)
        axe.legend()
        self.figure.canvas.draw()

class CSVGrapher(HasTraits):
    """
 主界面包括绘图列表,数据源,文件选择器和添加绘图按钮
 """
    graph_list = List(Instance(Graph)) # 绘图列表
    data_source = Instance(DataSource) # 数据源
    csv_file_name = File(filter=[u"*.csv"]) # 文件选择
    add_graph_button = Button(u"添加绘图") # 添加绘图按钮

    view = View(
        # 整个窗口分为上下两个部分
        VGroup(
            # 上部分横向放置控件,因此用HGroup
            HGroup(
                # 文件选择控件
                Item("csv_file_name", label=u"选择CSV文件", width=400),
                # 添加绘图按钮
                Item("add_graph_button", show_label=False)
            ),
            # 下部分是绘图列表,采用ListEditor编辑器显示
            Item("graph_list", style="custom", show_label=False,
                 editor=ListEditor(
                     use_notebook=True, # 是用多标签页格式显示
                     deletable=True, # 可以删除标签页
                     dock_style="tab", # 标签dock样式
                     page_name=".name") # 标题页的文本使用Graph对象的name属性
                )
        ),
        resizable = True,
        height = 0.8,
        width = 0.8,
        title = u"CSV数据绘图器"
    )

    def _csv_file_name_changed(self):
        """
 打开新文件时的处理,根据文件创建一个DataSource
 """
        self.data_source = DataSource()
        self.data_source.load_csv(self.csv_file_name)
        del self.graph_list[:]

    def _add_graph_button_changed(self):
        """
 添加绘图按钮的事件处理
 """
        if self.data_source != None:
            self.graph_list.append( Graph(data_source = self.data_source) )

if __name__ == "__main__":
    csv_grapher = CSVGrapher()
    csv_grapher.configure_traits()
程序中已经有比较详细的注释,这里就不再重复。如果你对traits库的某项用法还不太了解的话,可以直接查看其源代码,代码中都有详细的注释。下面是几个比较重点的部分:
整个程序的界面处理都只是组装View对象,看不到任何关于控件操作的代码,因此大大地节省了程序的开发时间。
通过配置141行的ListEditor,使其用标签页的方式显示graph_list中的每个元素,以此管理多个Graph对象。
在43行中,Graph类用HSplit将其数据选择部分和绘图控件部分分开,HSplit提供的更改左右部分的比例和隐藏的功能。
本书写作时所采用的traitsUI库版本为3.2,如果在标签页标题中输入中文,会出现错误,这是因为TraitsUI中还有些代码对unicode的支持不够,希望日后会有所改善。目前可以通过分析错误提示信息,修改TraitsUI库的源代码,只需要将下面提示中的770行中的str改为unicode既可以修复。
>>> from visual import *
之后就可以随心所欲的调用visual库通过的函数。需要注意的是如果你关闭了visual弹出的场景窗口的话,ipython对话也随之结束。如果你需要关闭场景窗口可以用下面的语句:
>>> scene.visible = False

在IPython中交互式地观察visual的运行结果
上图是用IPython交互式的使用visual的一个例子,可以看到通过IPython能够控制多个场景窗口。