第二十六章 Basemap 地理绘图
原文:Basemap Geographic Plotting with Matplotlib
译者:飞龙
在这个 Matplotlib 教程中,我们将涉及地理绘图模块Basemap。 Basemap是 Matplotlib 的扩展。
为了使用Basemap,我们首先需要安装它。 为了获得Basemap,你可以从这里获取:http://matplotlib.org/basemap/users/download.html,或者你可以访问http://www.lfd.uci.edu/~gohlke/pythonlibs/。
如果你在安装Basemap时遇到问题,请查看pip安装教程。
一旦你安装了Basemap,你就可以创建地图了。 首先,让我们投影一个简单的地图。 为此,我们需要导入Basemap,pyplot,创建投影,至少绘制某种轮廓或数据,然后我们可以显示图形。
from mpl_toolkits.basemap import Basemap
import matplotlib.pyplot as plt

m = Basemap(projection='mill')
m.drawcoastlines()
plt.show()
上面的代码结果如下:
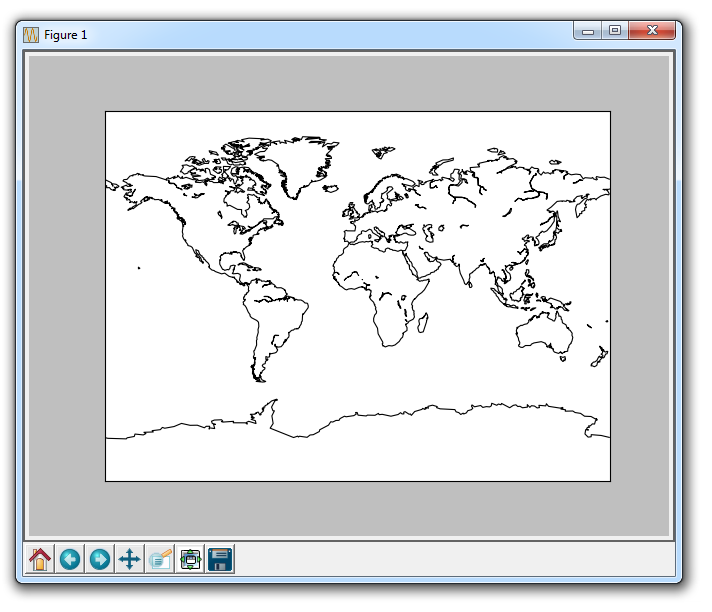
这是使用 Miller 投影完成的,这只是许多Basemap投影选项之一。