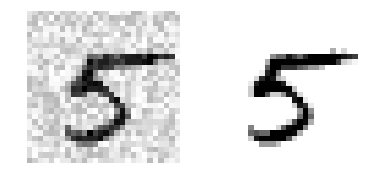
MNIST: the "Hello World" of Machine Learning
from scipy.io import loadmat
mnist_raw = loadmat("mnist-original.mat")
mnist = {
"data": mnist_raw["data"].T,
"target": mnist_raw["label"][0],
"COL_NAMES": ["label", "data"],
"DESCR": "mldata.org dataset: mnist-original",
}
mnist
{'COL_NAMES': ['label', 'data'],
 'DESCR': 'mldata.org dataset: mnist-original',
 'data': array([[0, 0, 0, ..., 0, 0, 0],
        [0, 0, 0, ..., 0, 0, 0],
        [0, 0, 0, ..., 0, 0, 0],
        ...,
        [0, 0, 0, ..., 0, 0, 0],
        [0, 0, 0, ..., 0, 0, 0],
        [0, 0, 0, ..., 0, 0, 0]], dtype=uint8),
 'target': array([ 0.,  0.,  0., ...,  9.,  9.,  9.])}
X,y = mnist['data'], mnist['target']
X.shape, y.shape
((70000, 784), (70000,))
%matplotlib inline
import matplotlib
import matplotlib.pyplot as plt
some_digit = X[36000]
some_digit_image = some_digit.reshape(28, 28)
plt.imshow(
some_digit_image,
cmap = matplotlib.cm.binary,
interpolation="nearest")
plt.axis("off")
plt.show()

y[36000]
5.0
X_train, X_test, y_train, y_test = X[:60000], X[60000:], y[:60000], y[60000:]
import numpy as np
shuffle_index = np.random.permutation(60000)
X_train, y_train = X_train[shuffle_index], y_train[shuffle_index]
print(X_train.shape, X_test.shape, y_train.shape, y_test.shape)
(60000, 784) (10000, 784) (60000,) (10000,)
Binary classifier training - distinguish between 2 classes
y_train_5 = (y_train == 5)
y_test_5 = (y_test == 5)
print(y_train_5.shape, y_train_5)
print(y_test_5.shape, y_test_5)
from sklearn.linear_model import SGDClassifier
sgd_clf = SGDClassifier(random_state=42)
sgd_clf.fit(X_train, y_train_5)
print(sgd_clf.predict([some_digit]))
(60000,) [False False False ..., False False False]
(10000,) [False False False ..., False False False]
[ True]
from sklearn.model_selection import cross_val_score
print(cross_val_score(
sgd_clf,
X_train,
y_train_5,
cv=3,
scoring="accuracy"))
[ 0.96795 0.96975 0.96855]
from sklearn.model_selection import StratifiedKFold
from sklearn.base import clone
skfolds = StratifiedKFold(n_splits=3, random_state=42)
for train_index, test_index in skfolds.split(X_train, y_train_5):
clone_clf = clone(sgd_clf)
X_train_folds = X_train[train_index]
y_train_folds = (y_train_5[train_index])
X_test_fold = X_train[test_index]
y_test_fold = (y_train_5[test_index])
clone_clf.fit(X_train_folds, y_train_folds)
y_pred = clone_clf.predict(X_test_fold)
n_correct = sum(y_pred == y_test_fold)
print(n_correct / len(y_pred))
0.96795
0.96975
0.96855
from sklearn.base import BaseEstimator
class Never5Classifier(BaseEstimator):
def fit(self, X, y=None):
pass
def predict(self, X):
return np.zeros((len(X), 1), dtype=bool)
never_5_clf = Never5Classifier()
print(cross_val_score(
never_5_clf,
X_train,
y_train_5,
cv=3,
scoring="accuracy"))
[ 0.9096 0.9124 0.90695]
Confusion Matrix - a better way of evaluating a classifier
from sklearn.model_selection import cross_val_predict
y_train_pred = cross_val_predict(sgd_clf, X_train, y_train_5, cv=3)
from sklearn.metrics import confusion_matrix
print(confusion_matrix(y_train_5, y_train_pred))
[[54044   535]
 [ 1340  4081]]
Classifier metrics: precision = TP/(TP+FP); recall (sensitivity) = TP/(TP+FN)
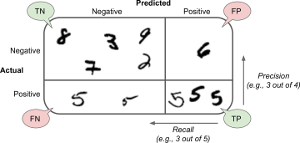
print(3841 / (3841+1515), 3841/(3841+1580))
0.7171396564600448 0.7085408596199964
from sklearn.metrics import precision_score, recall_score, f1_score
print("precision:\n",precision_score(y_train_5, y_train_pred))
print("recall:\n",recall_score(y_train_5, y_train_pred))
print("f1:\n",f1_score(y_train_5, y_train_pred))
precision:
 0.884098786828
recall:
 0.752813134108
f1:
 0.813191192587
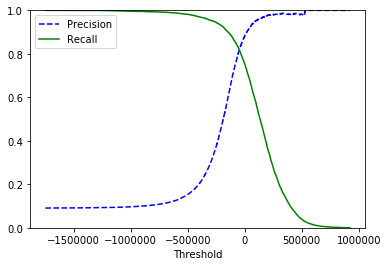
Precision/Recall Tradeoffs
y_scores = sgd_clf.decision_function([some_digit])
print(y_scores)
threshold = 0
y_some_digit_pred = (y_scores > threshold)
print(y_some_digit_pred)
[ 57844.42736708]
[ True]
threshold = 200000
y_some_digit_pred = (y_scores > threshold)
print(y_some_digit_pred)
[False]

y_scores = cross_val_predict(
sgd_clf,
X_train,
y_train_5,
cv=3,
method="decision_function")
from sklearn.metrics import precision_recall_curve
precisions, recalls, thresholds = precision_recall_curve(y_train_5, y_scores)
def plot_precision_recall_vs_threshold(precisions, recalls, thresholds):
plt.plot(thresholds,
precisions[:-1],
"b--",
label="Precision")
plt.plot(thresholds,
recalls[:-1],
"g-",
label="Recall")
plt.xlabel("Threshold")
plt.legend(loc="upper left")
plt.ylim([0, 1])
plot_precision_recall_vs_threshold(precisions, recalls, thresholds)
plt.show()
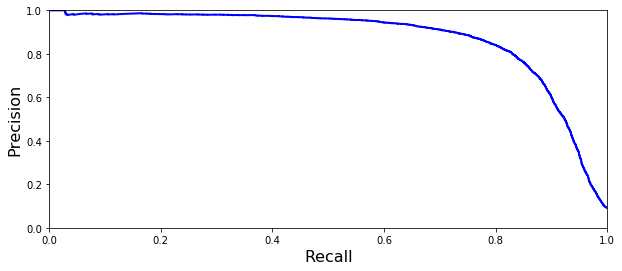
def plot_precision_vs_recall(precisions, recalls):
plt.plot(recalls, precisions, "b-", linewidth=2)
plt.xlabel("Recall", fontsize=16)
plt.ylabel("Precision", fontsize=16)
plt.axis([0, 1, 0, 1])
plt.figure(figsize=(10, 4))
plot_precision_vs_recall(precisions, recalls)
plt.show()
y_train_pred_90 = (y_scores > 50000)
print(y_train_pred_90.shape, y_train_pred_90)
print("precision:\n",precision_score(y_train_5, y_train_pred_90))
print("recall:\n",recall_score(y_train_5, y_train_pred_90))
(60000,) [False False False ..., False False False]
precision:
 0.924948770492
recall:
 0.666113263236
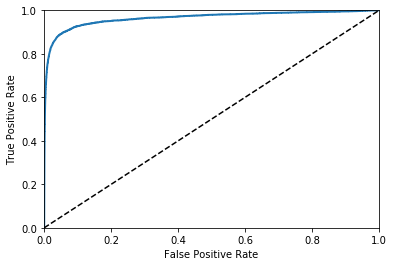
ROC (Receiver Operating Characteristic) curve
from sklearn.metrics import roc_curve
fpr, tpr, thresholds = roc_curve(y_train_5, y_scores)
def plot_roc_curve(fpr, tpr, label=None):
plt.plot(fpr, tpr, linewidth=2, label=label)
plt.plot([0, 1], [0, 1], 'k--')
plt.axis([0, 1, 0, 1])
plt.xlabel('False Positive Rate')
plt.ylabel('True Positive Rate')
plot_roc_curve(fpr, tpr)
plt.show()
from sklearn.metrics import roc_auc_score
print(roc_auc_score(y_train_5, y_scores))
0.964880839199
from sklearn.ensemble import RandomForestClassifier
forest_clf = RandomForestClassifier(random_state=42)
y_probas_forest = cross_val_predict(
forest_clf,
X_train,
y_train_5,
cv=3,
method="predict_proba")
y_scores_forest = y_probas_forest[:, 1]
fpr_forest, tpr_forest, thresholds_forest = roc_curve(y_train_5,y_scores_forest)
plt.plot(fpr, tpr, "b:", label="SGD")
plot_roc_curve(fpr_forest, tpr_forest, "Random Forest")
plt.legend(loc="lower right")
plt.show()
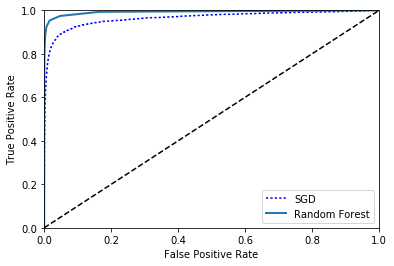
print(roc_auc_score(y_train_5, y_scores_forest))
y_train_pred_forest = cross_val_predict(
forest_clf,
X_train,
y_train_5,
cv=3)
print(precision_score(y_train_5, y_train_pred_forest))
print(recall_score(y_train_5, y_train_pred_forest))
0.992589481683
0.985567461185
0.831396421324
Multiclass Classification
sgd_clf.fit(X_train, y_train)
print(sgd_clf.predict([some_digit]))
[ 5.]
some_digit_scores = sgd_clf.decision_function([some_digit])
print(some_digit_scores)
print(sgd_clf.classes_)
[[-177277.32782496 -561668.18573184 -385895.43788059 -114677.95360751
  -410210.58824666   57844.42736708 -654717.63929413 -200777.6510135
  -772154.70175904 -614737.18986655]]
[ 0.  1.  2.  3.  4.  5.  6.  7.  8.  9.]
from sklearn.multiclass import OneVsOneClassifier
ovo_clf = OneVsOneClassifier(SGDClassifier(random_state=42))
ovo_clf.fit(X_train, y_train)
print("prediction:\n",ovo_clf.predict([some_digit]))
forest_clf.fit(X_train, y_train)
print("prediction via Random Forest:\n",forest_clf.predict([some_digit]))
print("probability via Random Forest:\n",forest_clf.predict_proba([some_digit]))
prediction:
 [ 5.]
prediction via Random Forest:
 [ 5.]
probability via Random Forest:
 [[ 0.1  0.   0.   0.1  0.   0.8  0.   0.   0.   0. ]]
print("CV score:\n",cross_val_score(
sgd_clf,
X_train,
y_train,
cv=3,
scoring="accuracy"))
CV score:
 [ 0.84843031  0.85419271  0.81062159]
from sklearn.preprocessing import StandardScaler
scaler = StandardScaler()
X_train_scaled = scaler.fit_transform(X_train.astype(np.float64))
print("CV score, scaled inputs:\n",cross_val_score(
sgd_clf,
X_train_scaled,
y_train,
cv=3,
scoring="accuracy"))
CV score, scaled inputs:
 [ 0.91011798  0.91089554  0.90908636]
Error Analysis
y_train_pred = cross_val_predict(
sgd_clf,
X_train_scaled,
y_train,
cv=3)
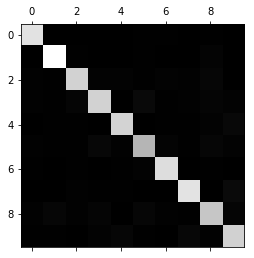
conf_mx = confusion_matrix(y_train, y_train_pred)
print("confusion matrix:\n",conf_mx)
plt.matshow(conf_mx, cmap=plt.cm.gray)
plt.show()
confusion matrix:
 [[5735    4   24   11   13   45   43    8   37    3]
 [   1 6489   43   24    6   35    8    8  116   12]
 [  57   38 5329   88   79   27   92   60  174   14]
 [  53   41  140 5333    2  234   35   60  142   91]
 [  17   26   36   10 5371    8   48   30   77  219]
 [  69   38   39  185   76 4600  114   28  175   97]
 [  34   24   42    2   41   95 5625    7   48    0]
 [  22   21   64   31   49    9    8 5792   14  255]
 [  54  157   70  148   14  158   58   28 5029  135]
 [  42   37   25   85  155   36    2  193   75 5299]]
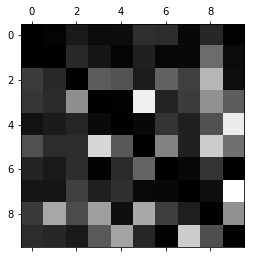
row_sums = conf_mx.sum(axis=1, keepdims=True)
norm_conf_mx = conf_mx / row_sums
np.fill_diagonal(norm_conf_mx, 0)
plt.matshow(norm_conf_mx, cmap=plt.cm.gray)
plt.show()
def plot_digits(instances, images_per_row=10, **options):
size = 28
images_per_row = min(len(instances), images_per_row)
images = [instance.reshape(size,size) for instance in instances]
n_rows = (len(instances) - 1) // images_per_row + 1
row_images = []
n_empty = n_rows * images_per_row - len(instances)
images.append(np.zeros((size, size * n_empty)))
for row in range(n_rows):
rimages = images[row * images_per_row : (row + 1) * images_per_row]
row_images.append(np.concatenate(rimages, axis=1))
image = np.concatenate(row_images, axis=0)
plt.imshow(image, cmap = matplotlib.cm.binary, **options)
plt.axis("off")
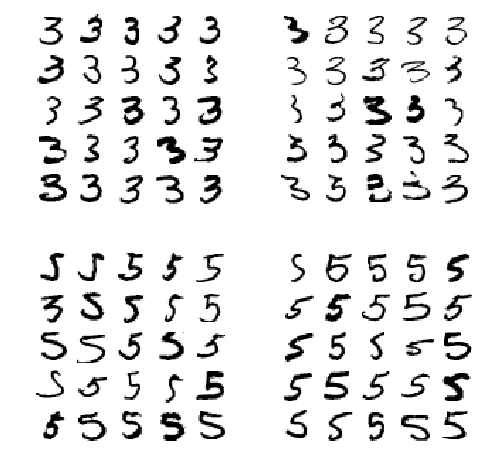
cl_a, cl_b = 3, 5
X_aa = X_train[(y_train == cl_a) & (y_train_pred == cl_a)]
X_ab = X_train[(y_train == cl_a) & (y_train_pred == cl_b)]
X_ba = X_train[(y_train == cl_b) & (y_train_pred == cl_a)]
X_bb = X_train[(y_train == cl_b) & (y_train_pred == cl_b)]
plt.figure(figsize=(8,8))
plt.subplot(221); plot_digits(X_aa[:25], images_per_row=5)
plt.subplot(222); plot_digits(X_ab[:25], images_per_row=5)
plt.subplot(223); plot_digits(X_ba[:25], images_per_row=5)
plt.subplot(224); plot_digits(X_bb[:25], images_per_row=5)
plt.show()
MultiLabel Classification
from sklearn.neighbors import KNeighborsClassifier
y_train_large = (y_train >= 7)
y_train_odd = (y_train % 2 == 1)
print("large nums?\n",y_train_large)
print("odd nums?\n",y_train_odd)
y_multilabel = np.c_[y_train_large, y_train_odd]
print("combined (multilabel)?\n",y_multilabel)
knn_clf = KNeighborsClassifier()
knn_clf.fit(X_train, y_multilabel)
print("KNN prediction of some_digit: (>=7? odd?)\n",knn_clf.predict([some_digit]))
large nums?
 [False False  True ..., False False False]
odd nums?
 [False False  True ..., False False False]
combined (multilabel)?
 [[False False]
 [False False]
 [ True  True]
 ...,
 [False False]
 [False False]
 [False False]]
KNN prediction of some_digit: (>=7? odd?)
 [[False  True]]
y_train_knn_pred = cross_val_predict(knn_clf, X_train, y_train, cv=3)
print(f1_score(
y_train,
y_train_knn_pred,
average="macro"))
0.968186511757
MultiOutput Classification
import numpy.random as rnd
noise = rnd.randint(0, 100, (len(X_train), 784))
X_train_mod = X_train + noise
noise = rnd.randint(0, 100, (len(X_test), 784))
X_test_mod = X_test + noise
y_train_mod = X_train
y_test_mod = X_test
some_index = 5500
def plot_digit(data):
    image = data.reshape(28, 28)
    plt.imshow(image, cmap = matplotlib.cm.binary,
               interpolation="nearest")
    plt.axis("off")
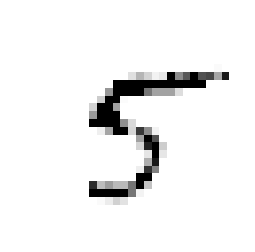
knn_clf.fit(X_train_mod, y_train_mod)
clean_digit = knn_clf.predict([X_test_mod[some_index]])
plot_digit(clean_digit)
some_index = 5500
plt.subplot(121); plot_digit(X_test_mod[some_index])
plt.subplot(122); plot_digit(y_test_mod[some_index])
plt.show()
