Intro
- Dimesionality reduction is lossy. It may speed up training but can degrade result quality. Also makes pipelines more complex. Try using original data before considering dimensionality reduction.
Very useful for visualization (2D, 3D representations more intuitive.)
Two main approaches: projection, manifold learning.
- Three most popular techniques: PCA, Kernel PCA, LLE.
Curse of Dimensionality
- Many things behave differently in high-D space.
1) Most points in high-D hypercube will be very close to a border.
2) Distances between random points much greater (very high probability of sparse matrix representation).
- In 2D: ~0.52
- In 3D: ~0.66
- In 1,000,000D: ~408 ~ sqrt(1000000/6)
Approaches: Projection
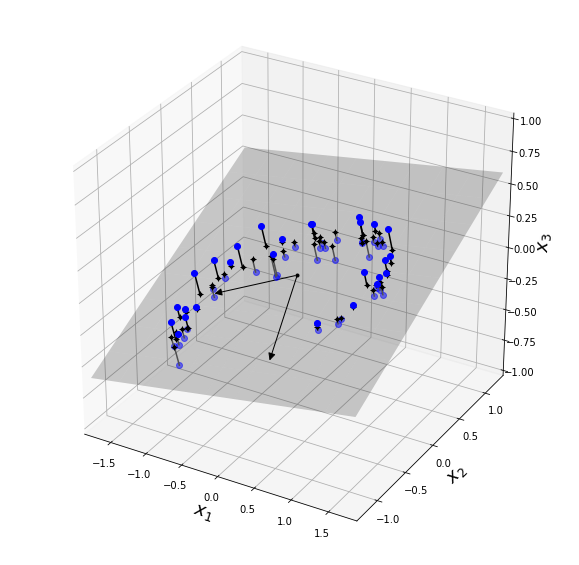
- Most dataset features are concentrated in a few dimensions - not uniformly across all. Much learnable training can be found in low-D subspace.
import numpy as np
import numpy.random as rnd
# build a 3D dataset

rnd.seed(4)
m = 60
w1, w2 = 0.1, 0.3
noise = 0.1

angles = rnd.rand(m) * 3 * np.pi / 2 - 0.5
X = np.empty((m, 3))
X[:, 0] = np.cos(angles) + np.sin(angles)/2 + noise * rnd.randn(m) / 2
X[:, 1] = np.sin(angles) * 0.7 + noise * rnd.randn(m) / 2
X[:, 2] = X[:, 0] * w1 + X[:, 1] * w2 + noise * rnd.randn(m)

# mean-normalize the data
X = X - X.mean(axis=0)

# apply PCA to reduce to 2D
from sklearn.decomposition import PCA

pca = PCA(n_components = 2)
X2D = pca.fit_transform(X)

# recover 3D points projected on 2D plane
X2D_inv = pca.inverse_transform(X2D)
# utility to draw 3D arrows
from matplotlib.patches import FancyArrowPatch
from mpl_toolkits.mplot3d import proj3d

class Arrow3D(FancyArrowPatch):
    def __init__(self, xs, ys, zs, *args, **kwargs):
        FancyArrowPatch.__init__(self, (0,0), (0,0), *args, **kwargs)
        self._verts3d = xs, ys, zs

    def draw(self, renderer):
        xs3d, ys3d, zs3d = self._verts3d
        xs, ys, zs = proj3d.proj_transform(xs3d, ys3d, zs3d, renderer.M)
        self.set_positions((xs[0],ys[0]),(xs[1],ys[1]))
        FancyArrowPatch.draw(self, renderer)

# express plane as function of x,y
axes = [-1.8, 1.8, -1.3, 1.3, -1.0, 1.0]

x1s = np.linspace(axes[0], axes[1], 10)
x2s = np.linspace(axes[2], axes[3], 10)
x1, x2 = np.meshgrid(x1s, x2s)

C = pca.components_
R = C.T.dot(C)
z = (R[0, 2] * x1 + R[1, 2] * x2) / (1 - R[2, 2])
# plot 3D dataset, plane & projections

import matplotlib.pyplot as plt
from mpl_toolkits.mplot3d import Axes3D

fig = plt.figure(figsize=(10, 10))
ax = fig.add_subplot(111, projection='3d')

X3D_above = X[X[:, 2] > X2D_inv[:, 2]]
X3D_below = X[X[:, 2] <= X2D_inv[:, 2]]

ax.plot(X3D_below[:, 0], X3D_below[:, 1], X3D_below[:, 2], "bo", alpha=0.5)

ax.plot_surface(x1, x2, z, alpha=0.2, color="k")
np.linalg.norm(C, axis=0)
ax.add_artist(Arrow3D([0, C[0, 0]],[0, C[0, 1]],[0, C[0, 2]], mutation_scale=15, lw=1, arrowstyle="-|>", color="k"))
ax.add_artist(Arrow3D([0, C[1, 0]],[0, C[1, 1]],[0, C[1, 2]], mutation_scale=15, lw=1, arrowstyle="-|>", color="k"))
ax.plot([0], [0], [0], "k.")

for i in range(m):
    if X[i, 2] > X2D_inv[i, 2]:
        ax.plot([X[i][0], X2D_inv[i][0]], [X[i][1], X2D_inv[i][1]], [X[i][2], X2D_inv[i][2]], "k-")
    else:
        ax.plot([X[i][0], X2D_inv[i][0]], [X[i][1], X2D_inv[i][1]], [X[i][2], X2D_inv[i][2]], "k-", color="#505050")

ax.plot(X2D_inv[:, 0], X2D_inv[:, 1], X2D_inv[:, 2], "k+")
ax.plot(X2D_inv[:, 0], X2D_inv[:, 1], X2D_inv[:, 2], "k.")
ax.plot(X3D_above[:, 0], X3D_above[:, 1], X3D_above[:, 2], "bo")
ax.set_xlabel("$x_1$", fontsize=18)
ax.set_ylabel("$x_2$", fontsize=18)
ax.set_zlabel("$x_3$", fontsize=18)
ax.set_xlim(axes[0:2])
ax.set_ylim(axes[2:4])
ax.set_zlim(axes[4:6])

#save_fig("dataset_3d_plot")
plt.show()
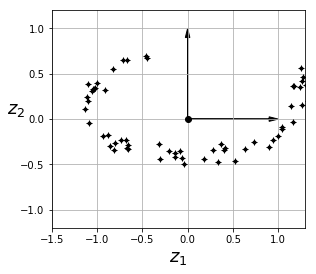
# 2D projection equivalent:
fig = plt.figure()
ax = fig.add_subplot(111, aspect='equal')
ax.plot(X2D[:, 0], X2D[:, 1], "k+")
ax.plot(X2D[:, 0], X2D[:, 1], "k.")
ax.plot([0], [0], "ko")
ax.arrow(0, 0, 0, 1, head_width=0.05, length_includes_head=True, head_length=0.1, fc='k', ec='k')
ax.arrow(0, 0, 1, 0, head_width=0.05, length_includes_head=True, head_length=0.1, fc='k', ec='k')
ax.set_xlabel("$z_1$", fontsize=18)
ax.set_ylabel("$z_2$", fontsize=18, rotation=0)
ax.axis([-1.5, 1.3, -1.2, 1.2])
ax.grid(True)
plt.show()
Approaches: Manifolds
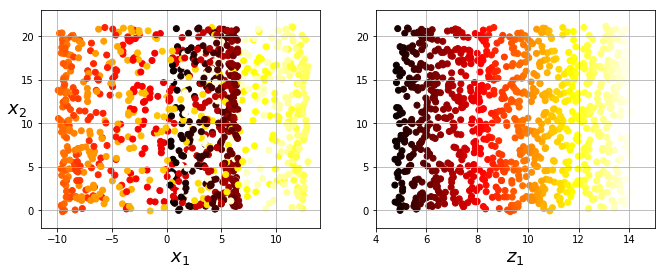
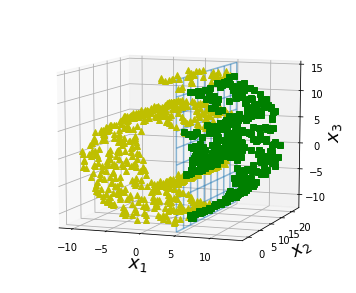
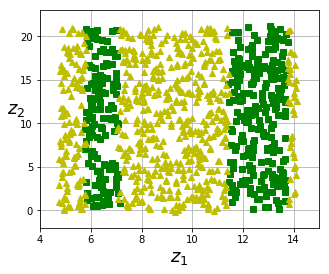
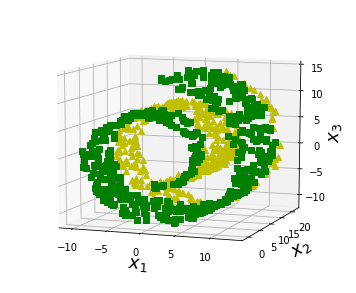
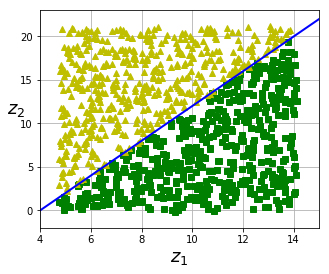
- Manifolds = shapes that can be bent/twisted in higher-D space.
- ex: "Swiss roll" problem
# Swiss roll visualization:
from sklearn.datasets import make_swiss_roll
X, t = make_swiss_roll(n_samples=1000, noise=0.2, random_state=42)

axes = [-11.5, 14, -2, 23, -12, 15]

fig = plt.figure(figsize=(8, 6))
ax = fig.add_subplot(111, projection='3d')

ax.scatter(X[:, 0], X[:, 1], X[:, 2], c=t, cmap=plt.cm.hot)
ax.view_init(10, -70)
ax.set_xlabel("$x_1$", fontsize=18)
ax.set_ylabel("$x_2$", fontsize=18)
ax.set_zlabel("$x_3$", fontsize=18)
ax.set_xlim(axes[0:2])
ax.set_ylim(axes[2:4])
ax.set_zlim(axes[4:6])

#save_fig("swiss_roll_plot")
plt.show()

# "squashed" swiss roll visualization:
plt.figure(figsize=(11, 4))

plt.subplot(121)
plt.scatter(X[:, 0], X[:, 1], c=t, cmap=plt.cm.hot)
plt.axis(axes[:4])
plt.xlabel("$x_1$", fontsize=18)
plt.ylabel("$x_2$", fontsize=18, rotation=0)
plt.grid(True)

plt.subplot(122)
plt.scatter(t, X[:, 1], c=t, cmap=plt.cm.hot)
plt.axis([4, 15, axes[2], axes[3]])
plt.xlabel("$z_1$", fontsize=18)
plt.grid(True)

#save_fig("squished_swiss_roll_plot")
plt.show()
from matplotlib import gridspec

axes = [-11.5, 14, -2, 23, -12, 15]

x2s = np.linspace(axes[2], axes[3], 10)
x3s = np.linspace(axes[4], axes[5], 10)
x2, x3 = np.meshgrid(x2s, x3s)

fig = plt.figure(figsize=(6, 5))
ax = plt.subplot(111, projection='3d')

positive_class = X[:, 0] > 5
X_pos = X[positive_class]
X_neg = X[~positive_class]

ax.view_init(10, -70)
ax.plot(X_neg[:, 0], X_neg[:, 1], X_neg[:, 2], "y^")
ax.plot_wireframe(5, x2, x3, alpha=0.5)
ax.plot(X_pos[:, 0], X_pos[:, 1], X_pos[:, 2], "gs")
ax.set_xlabel("$x_1$", fontsize=18)
ax.set_ylabel("$x_2$", fontsize=18)
ax.set_zlabel("$x_3$", fontsize=18)
ax.set_xlim(axes[0:2])
ax.set_ylim(axes[2:4])
ax.set_zlim(axes[4:6])

#save_fig("manifold_decision_boundary_plot1")
plt.show()

fig = plt.figure(figsize=(5, 4))
ax = plt.subplot(111)

plt.plot(t[positive_class], X[positive_class, 1], "gs")
plt.plot(t[~positive_class], X[~positive_class, 1], "y^")
plt.axis([4, 15, axes[2], axes[3]])
plt.xlabel("$z_1$", fontsize=18)
plt.ylabel("$z_2$", fontsize=18, rotation=0)
plt.grid(True)

#save_fig("manifold_decision_boundary_plot2")
plt.show()

fig = plt.figure(figsize=(6, 5))
ax = plt.subplot(111, projection='3d')

positive_class = 2 * (t[:] - 4) > X[:, 1]
X_pos = X[positive_class]
X_neg = X[~positive_class]
ax.view_init(10, -70)
ax.plot(X_neg[:, 0], X_neg[:, 1], X_neg[:, 2], "y^")
ax.plot(X_pos[:, 0], X_pos[:, 1], X_pos[:, 2], "gs")
ax.set_xlabel("$x_1$", fontsize=18)
ax.set_ylabel("$x_2$", fontsize=18)
ax.set_zlabel("$x_3$", fontsize=18)
ax.set_xlim(axes[0:2])
ax.set_ylim(axes[2:4])
ax.set_zlim(axes[4:6])

#save_fig("manifold_decision_boundary_plot3")
plt.show()

fig = plt.figure(figsize=(5, 4))
ax = plt.subplot(111)

plt.plot(t[positive_class], X[positive_class, 1], "gs")
plt.plot(t[~positive_class], X[~positive_class, 1], "y^")
plt.plot([4, 15], [0, 22], "b-", linewidth=2)
plt.axis([4, 15, axes[2], axes[3]])
plt.xlabel("$z_1$", fontsize=18)
plt.ylabel("$z_2$", fontsize=18, rotation=0)
plt.grid(True)

#save_fig("manifold_decision_boundary_plot4")
plt.show()

# Lesson learned (below):
# Unrolling a dataset to a lower dimension doesn't necessarily lead to
# a simpler representation.
PCA (Principal Component Analysis)
- Most popular DR algorithm
- 1) Finds hyperplane that lies closest to the data
- 2) Projects data onto it
Preserving Variance
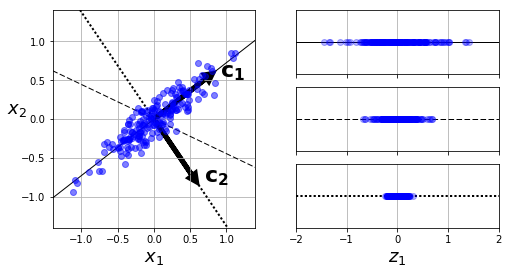
- Below: simple 2D dataset projected onto 3 different axes.
- Projection on solid line preserves the maximum variance. (Therefore less likely to lose information.)
angle = np.pi / 5
stretch = 5
m = 200

rnd.seed(3)
X = rnd.randn(m, 2) / 10
X = X.dot(np.array([[stretch, 0],[0, 1]])) # stretch
X = X.dot([[np.cos(angle), np.sin(angle)], [-np.sin(angle), np.cos(angle)]]) # rotate

u1 = np.array([np.cos(angle), np.sin(angle)])
u2 = np.array([np.cos(angle - 2 * np.pi/6), np.sin(angle - 2 * np.pi/6)])
u3 = np.array([np.cos(angle - np.pi/2), np.sin(angle - np.pi/2)])

X_proj1 = X.dot(u1.reshape(-1, 1))
X_proj2 = X.dot(u2.reshape(-1, 1))
X_proj3 = X.dot(u3.reshape(-1, 1))

plt.figure(figsize=(8,4))
plt.subplot2grid((3,2), (0, 0), rowspan=3)
plt.plot([-1.4, 1.4], [-1.4*u1[1]/u1[0], 1.4*u1[1]/u1[0]], "k-", linewidth=1)
plt.plot([-1.4, 1.4], [-1.4*u2[1]/u2[0], 1.4*u2[1]/u2[0]], "k--", linewidth=1)
plt.plot([-1.4, 1.4], [-1.4*u3[1]/u3[0], 1.4*u3[1]/u3[0]], "k:", linewidth=2)
plt.plot(X[:, 0], X[:, 1], "bo", alpha=0.5)
plt.axis([-1.4, 1.4, -1.4, 1.4])
plt.arrow(0, 0, u1[0], u1[1], head_width=0.1, linewidth=5, length_includes_head=True, head_length=0.1, fc='k', ec='k')
plt.arrow(0, 0, u3[0], u3[1], head_width=0.1, linewidth=5, length_includes_head=True, head_length=0.1, fc='k', ec='k')
plt.text(u1[0] + 0.1, u1[1] - 0.05, r"$\mathbf{c_1}$", fontsize=22)
plt.text(u3[0] + 0.1, u3[1], r"$\mathbf{c_2}$", fontsize=22)
plt.xlabel("$x_1$", fontsize=18)
plt.ylabel("$x_2$", fontsize=18, rotation=0)
plt.grid(True)

plt.subplot2grid((3,2), (0, 1))
plt.plot([-2, 2], [0, 0], "k-", linewidth=1)
plt.plot(X_proj1[:, 0], np.zeros(m), "bo", alpha=0.3)
plt.gca().get_yaxis().set_ticks([])
plt.gca().get_xaxis().set_ticklabels([])
plt.axis([-2, 2, -1, 1])
plt.grid(True)

plt.subplot2grid((3,2), (1, 1))
plt.plot([-2, 2], [0, 0], "k--", linewidth=1)
plt.plot(X_proj2[:, 0], np.zeros(m), "bo", alpha=0.3)
plt.gca().get_yaxis().set_ticks([])
plt.gca().get_xaxis().set_ticklabels([])
plt.axis([-2, 2, -1, 1])
plt.grid(True)

plt.subplot2grid((3,2), (2, 1))
plt.plot([-2, 2], [0, 0], "k:", linewidth=2)
plt.plot(X_proj3[:, 0], np.zeros(m), "bo", alpha=0.3)
plt.gca().get_yaxis().set_ticks([])
plt.axis([-2, 2, -1, 1])
plt.xlabel("$z_1$", fontsize=18)
plt.grid(True)

#save_fig("pca_best_projection")
plt.show()
Principal Components
- PCA finds axis responsible for largest amount of variance in dataset.
- Also finds 2nd axis, responsible for next largest amount.
- If higher-D dataset, PCA also finds 3rd axis...
- Repeat for # of dimensions in the dataset.
Each axis vector is called a principal component. (PC)
PCs found using Singular Value Decomposition (SVD), a matrix factorization technique.
- SVD decomposes training set matrix X into dot product of three matrices.
- Note: PCA assumes data is centered around origin. Scikit PCA will adjust data for you if needed.
# use NumPy svd() to get principal components of training set,
# then extract 1st two PCs.

X_centered = X - X.mean(axis=0)
U,s,V = np.linalg.svd(X_centered)

c1, c2 = V.T[:,0], V.T[:,1]
print(c1,c2)
[-0.79644131 -0.60471583] [-0.60471583 0.79644131]
Projecting Training Data Down to d Dimensions
- Done by computing dot product of training data (X) by matrix containing the first d principal components (Wd).
# project training set onto plane defined by 1st two PCs.

W2 = V.T[:, :2]
X2D = X_centered.dot(W2)
print(X2D)
[[ -8.96088137e-01   2.61576283e-02]
 [ -4.53603363e-02  -1.85948860e-01]
 [  1.38359166e-01  -3.11666166e-02]
 [  4.16315780e-02  -6.04371773e-02]
 [  2.18583744e-02  -4.58726693e-02]
 [  6.53868464e-01   1.03673047e-01]
 [ -4.45218566e-01   1.63002740e-01]
 [ -2.52100754e-02  -3.96098381e-02]
 [  2.74828447e-01  -1.47486328e-01]
 [ -4.89804685e-01  -1.19064333e-01]
 [  5.91772943e-01  -6.68825324e-03]
 [ -7.44460369e-01   9.37220434e-03]
 [  5.12230114e-01  -5.91117152e-02]
 [ -3.13266691e-01  -2.12641588e-02]
 [  3.83765553e-01  -1.35145070e-02]
 [ -3.77664930e-01   1.91087392e-01]
 [  6.22192127e-01  -4.81326634e-02]
 [  4.05843018e-01  -2.32002753e-01]
 [  4.62900292e-01  -9.12474313e-02]
 [ -5.62638042e-01  -2.36637544e-02]
 [  8.09046208e-01   8.31463215e-02]
 [  1.80719622e-01  -1.69142171e-01]
 [  2.98447518e-01  -5.11785151e-02]
 [  4.35729072e-01   1.35618235e-02]
 [  1.12339132e+00  -1.68707469e-03]
 [ -5.09329756e-01   7.59538223e-02]
 [ -5.57383436e-01   1.01605408e-01]
 [ -7.42300017e-01  -1.26114063e-01]
 [ -4.19950471e-01  -1.93589947e-01]
 [  3.04360690e-01  -1.83671045e-01]
 [ -5.27822154e-01   1.23668447e-01]
 [  9.38906116e-02   1.80883149e-01]
 [  3.35918853e-01   2.35494590e-02]
 [ -7.52638095e-02  -1.06632109e-01]
 [ -2.24065944e-01   1.90613293e-01]
 [  5.09402619e-01   1.02097673e-01]
 [  7.24520511e-02   1.79929048e-01]
 [ -2.44318685e-01   6.38817933e-02]
 [ -3.23087658e-01   1.94977998e-02]
 [  6.93739438e-01   1.55229402e-01]
 [  6.83626747e-01   3.96804666e-02]
 [ -3.06255432e-01  -8.88712253e-02]
 [ -7.60306544e-02   1.16609123e-01]
 [  1.28713987e-02  -8.72153282e-02]
 [  1.45854192e+00  -6.50410607e-02]
 [  2.95510472e-01  -4.40211613e-02]
 [  4.78043426e-01   4.92202601e-02]
 [  2.86468892e-01  -3.50652486e-03]
 [ -3.38708502e-01  -9.13086575e-02]
 [  1.44466110e-01   2.20308932e-01]
 [ -4.35369951e-01  -1.37167289e-01]
 [  3.76189231e-02   5.86533049e-02]
 [ -6.17964798e-01   3.26551523e-03]
 [  2.65720436e-01  -6.60652314e-02]
 [ -3.24171713e-01   2.58737230e-02]
 [  2.57613005e-01  -1.20787043e-02]
 [  2.05472262e-01   7.82147166e-02]
 [  3.42825581e-01   5.72823775e-02]
 [ -4.27742475e-01   4.10117883e-02]
 [  4.13138475e-01   1.44642428e-01]
 [  3.37079378e-01   5.11618950e-02]
 [  3.79209530e-01  -1.65052243e-01]
 [ -1.14507596e-01   2.76931986e-02]
 [  3.70774307e-02   2.97937650e-02]
 [  3.24636337e-01  -6.55164554e-02]
 [  7.89476581e-02   1.94034121e-01]
 [ -4.07272297e-01  -5.92029130e-02]
 [ -2.79337894e-01  -5.23406778e-02]
 [  2.25715170e-01   9.21073425e-02]
 [  2.65055409e-01  -1.60611082e-01]
 [  4.51907852e-01   1.97745374e-02]
 [ -6.76603521e-02   1.24160746e-01]
 [  3.55338456e-01   8.20568965e-02]
 [ -2.13673993e-01  -1.80131732e-02]
 [ -4.19919072e-01   4.17639004e-02]
 [  4.27746050e-01   1.17613622e-01]
 [  6.09137236e-01   2.02104565e-02]
 [ -3.16955986e-03   4.38048374e-02]
 [  3.61657526e-01   5.53222800e-03]
 [  6.71393848e-02   1.02545906e-01]
 [  3.96663191e-01   1.70419112e-02]
 [  1.32276395e-01  -1.25644673e-01]
 [ -1.33866070e+00  -3.39620117e-02]
 [  7.39140839e-01   1.57883864e-01]
 [  5.33339338e-01   4.97439820e-02]
 [ -4.31004868e-01  -7.25504028e-02]
 [  2.15484246e-01  -4.80950244e-02]
 [  6.70354778e-02  -1.59469510e-01]
 [  6.16925576e-01   3.30095454e-04]
 [ -5.21745049e-01   5.35816552e-02]
 [ -8.67032328e-01   5.25304916e-02]
 [  2.54714484e-01  -5.51554532e-03]
 [  1.01594493e+00  -7.32702485e-02]
 [  5.08443285e-01   3.91889488e-02]
 [ -3.23713333e-01  -6.14794166e-02]
 [  2.96394651e-01  -1.47039271e-01]
 [  6.22912229e-02   2.75349476e-02]
 [ -2.22242499e-01  -8.15775375e-02]
 [ -9.97596213e-01   9.98881775e-02]
 [  4.76677524e-02  -5.03263425e-02]
 [  1.59385630e-01   1.98770961e-02]
 [  7.23983658e-03   4.99150260e-02]
 [ -3.88330571e-01   1.29862055e-01]
 [ -5.74324601e-01  -2.17412761e-02]
 [ -1.94317864e-01  -4.14215200e-02]
 [  2.88462890e-01   1.98608595e-01]
 [  2.24621449e-01   2.05254821e-01]
 [  1.72893464e-01   3.03337593e-02]
 [ -5.45686322e-01  -7.71908926e-03]
 [ -1.97062110e-01  -2.69019260e-02]
 [  2.37006918e-01  -1.01833788e-02]
 [  3.20293812e-01   1.71329418e-01]
 [  7.91454892e-02   1.75373382e-01]
 [  1.34116467e+00   3.15311858e-02]
 [ -2.81345950e-01  -3.39245876e-02]
 [ -5.49606098e-01   5.37889594e-02]
 [  1.35299898e-01   4.77632442e-02]
 [ -1.40721018e+00  -3.07936334e-03]
 [ -1.49842206e-01  -4.57709563e-02]
 [ -6.50670013e-02  -1.28928620e-01]
 [  9.28880501e-02   2.49171453e-01]
 [ -5.35894030e-01   5.42510650e-02]
 [ -5.56858738e-01   1.77869868e-01]
 [ -3.02147552e-01   2.02159209e-01]
 [ -5.36183631e-01   6.74427775e-03]
 [ -8.55623983e-01  -2.52623485e-01]
 [  2.83998192e-01   3.39738443e-02]
 [  4.55220905e-01  -4.60837740e-03]
 [  3.19652268e-01  -5.73147775e-02]
 [ -1.35803712e+00   3.55141032e-02]
 [  2.31421394e-02   1.33432806e-01]
 [  1.15723020e-01   9.23933561e-02]
 [ -1.79851419e-01   1.60298502e-01]
 [  7.07110703e-01   9.29033427e-02]
 [ -5.97227204e-02  -1.15625175e-01]
 [ -5.31804111e-01  -9.70759692e-02]
 [ -8.11573484e-01   3.56003677e-02]
 [ -3.48886570e-01   2.08692440e-03]
 [ -4.49281442e-01  -1.94684913e-01]
 [ -3.70829130e-02  -6.22225918e-02]
 [ -1.42251513e-01  -6.31866218e-03]
 [ -3.07506144e-01  -8.88695185e-02]
 [ -9.25307571e-01   2.13517965e-01]
 [  1.03097886e-01   2.07573310e-03]
 [ -1.47464910e-01   1.24724802e-01]
 [ -9.46748876e-01  -1.39178787e-01]
 [  3.08673618e-01  -9.83295182e-02]
 [  5.58671697e-01  -1.50783004e-01]
 [ -1.79969356e-01  -1.18326957e-01]
 [ -7.54431603e-01   7.63370593e-02]
 [  5.15860621e-01  -9.07637328e-02]
 [  3.02119496e-01   1.47799162e-01]
 [  4.26806702e-01  -1.38986614e-01]
 [  2.28667680e-02   3.92283202e-02]
 [  3.24088211e-01   1.70213975e-01]
 [ -1.22209299e-01   4.41346966e-02]
 [  4.26702773e-01   6.42551604e-03]
 [  8.19816829e-02  -2.24146989e-01]
 [ -1.41063811e-01  -1.81097498e-01]
 [  1.64457703e-02  -1.45681492e-01]
 [ -1.01134103e+00   1.26993172e-02]
 [ -4.33573355e-01   8.41743009e-02]
 [  6.65856885e-01  -2.12785979e-01]
 [  1.61808196e-01   9.45467292e-02]
 [ -4.82157648e-02   7.89423282e-02]
 [ -4.66117068e-01  -1.57706328e-01]
 [ -1.49009196e-01   1.94946740e-01]
 [  2.88429562e-01  -1.95469647e-01]
 [  1.15854187e-01  -4.26347471e-02]
 [ -2.08314238e-01  -9.22559093e-02]
 [ -4.17242418e-02  -2.21272525e-01]
 [ -4.31285498e-01   1.51023258e-01]
 [ -6.46651297e-01  -1.63796812e-01]
 [ -1.54321959e-01  -3.00319930e-01]
 [ -1.42477982e-01  -8.04414843e-03]
 [  4.96009127e-01   4.62484050e-02]
 [ -7.20255309e-02   9.38505820e-02]
 [ -6.51879918e-02   2.35315556e-02]
 [  9.73713335e-01  -9.40602754e-02]
 [  2.36218522e-01   3.60724373e-02]
 [ -1.06876746e-03   1.51498555e-01]
 [  4.34435954e-01  -1.34060334e-02]
 [ -1.28076019e-01  -2.44578006e-02]
 [ -2.47584073e-01  -6.08927420e-02]
 [ -7.10391471e-01  -4.55521748e-02]
 [ -5.58836834e-01  -1.34202263e-02]
 [ -7.43699081e-01  -1.54131331e-01]
 [ -2.58481292e-01  -4.73208896e-02]
 [ -1.19242387e-01   1.18190473e-01]
 [  5.71157514e-01  -1.18785924e-01]
 [  4.97483707e-01   3.73368260e-02]
 [  9.41952705e-01   3.09293927e-02]
 [  6.44331385e-01  -9.94076651e-02]
 [  1.82692942e-01   4.33205574e-02]
 [  3.13123024e-01  -4.12117592e-02]
 [  2.04403918e-02  -2.54497816e-02]
 [  1.33781786e+00  -1.34015280e-02]
 [ -4.58399199e-02   1.10234115e-01]
 [ -1.02539769e+00   4.64829485e-02]
 [ -3.85549579e-02  -9.59123942e-02]]
Scikit PCA
- Uses SVD decomposition as before.
- You can access each PC using components_ variable. (
from sklearn.decomposition import PCA
pca = PCA(n_components = 2)
X2D = pca.fit_transform(X)

print(pca.components_[0])
print(pca.components_.T[:,0])
[-0.79644131 -0.60471583]
[-0.79644131 -0.60471583]
Explained Variance Ratio
- Very useful metric: proportion of dataset's variance along the axis of each PC component.
# 95% of dataset variance explained by 1st axis.
print(pca.explained_variance_ratio_)
[ 0.95369864 0.04630136]
Choosing Right #Dimensions
- No need to choose arbitrary #dimensions. Instead pick d that cumulatively accounts for a sufficient amount, ex: 95%.
# find minimum d to preserve 95% of training set variance
pca = PCA()
pca.fit(X)
cumsum = np.cumsum(pca.explained_variance_ratio_)
d = np.argmax(cumsum >= 0.95) + 1
print(d)
1
PCA for Compression
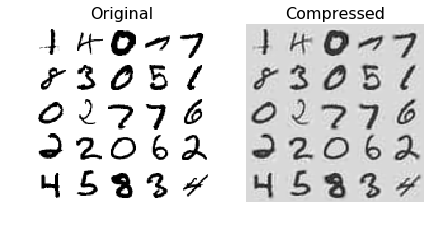
- Example applying PCA to MNIST dataset with 95% preservation = results in ~150 features (original = 28x28 = 784)
#MNIST compression:
from sklearn.model_selection import train_test_split
from sklearn.datasets import fetch_mldata

#mnist = fetch_mldata('MNIST original')
mnist_path = "./mnist-original.mat"

from scipy.io import loadmat
mnist_raw = loadmat(mnist_path)
mnist = {
    "data": mnist_raw["data"].T,
    "target": mnist_raw["label"][0],
    "COL_NAMES": ["label", "data"],
    "DESCR": "mldata.org dataset: mnist-original",
    }

X, y = mnist["data"], mnist["target"]
X_train, X_test, y_train, y_test = train_test_split(X, y)

X = X_train

pca = PCA()
pca.fit(X)
d = np.argmax(np.cumsum(pca.explained_variance_ratio_) >= 0.95) + 1
d
154
pca = PCA(n_components=0.95)
X_reduced = pca.fit_transform(X)
pca.n_components_
154
# did you hit your 95% minimum?
np.sum(pca.explained_variance_ratio_)
0.9503623084769206
# use inverse_transform to decompress back to 784 dimensions
X_mnist = X_train

pca = PCA(n_components = 154)
X_mnist_reduced = pca.fit_transform(X_mnist)
X_mnist_recovered = pca.inverse_transform(X_mnist_reduced)
import matplotlib
import matplotlib.pyplot as plt

def plot_digits(instances, images_per_row=5, **options):
    size = 28
    images_per_row = min(len(instances), images_per_row)
    images = [instance.reshape(size,size) for instance in instances]
    n_rows = (len(instances) - 1) // images_per_row + 1
    row_images = []
    n_empty = n_rows * images_per_row - len(instances)
    images.append(np.zeros((size, size * n_empty)))
    for row in range(n_rows):
        rimages = images[row * images_per_row : (row + 1) * images_per_row]
        row_images.append(np.concatenate(rimages, axis=1))
    image = np.concatenate(row_images, axis=0)
    plt.imshow(image, cmap = matplotlib.cm.binary, **options)
    plt.axis("off")

plt.figure(figsize=(7, 4))
plt.subplot(121)
plot_digits(X_mnist[::2100])
plt.title("Original", fontsize=16)
plt.subplot(122)
plot_digits(X_mnist_recovered[::2100])
plt.title("Compressed", fontsize=16)
#save_fig("mnist_compression_plot")
plt.show()
Incremental PCA
- PCA normally requires entire dataset in memory for SVD algorithm.
- Incremental PCA (IPCA) splits dataset into batches.
# split MNIST into 100 minibatches using Numpy array_split()
# reduce MNIST down to 154 dimensions as before.
# note use of partial_fit() for each batch.

from sklearn.decomposition import IncrementalPCA

n_batches = 100
inc_pca = IncrementalPCA(n_components=154)

for X_batch in np.array_split(X_mnist, n_batches):
    print(".", end="")
    inc_pca.partial_fit(X_batch)

X_mnist_reduced_inc = inc_pca.transform(X_mnist)
....................................................................................................
# alternative: Numpy memmap class (use binary array on disk as if it was in memory)

filename = "my_mnist.data"

X_mm = np.memmap(
    filename, dtype='float32', mode='write', shape=X_mnist.shape)

X_mm[:] = X_mnist
del X_mm
X_mm = np.memmap(filename, dtype='float32', mode='readonly', shape=X_mnist.shape)

batch_size = len(X_mnist) // n_batches
inc_pca = IncrementalPCA(n_components=154, batch_size=batch_size)
inc_pca.fit(X_mm)
IncrementalPCA(batch_size=525, copy=True, n_components=154, whiten=False)
rnd_pca = PCA(
    n_components=154,
    random_state=42,
    svd_solver="randomized")

X_reduced = rnd_pca.fit_transform(X_mnist)
import time

for n_components in (2, 10, 154):
    print("n_components =", n_components)
    regular_pca = PCA(
        n_components=n_components)
    inc_pca     = IncrementalPCA(
        n_components=154,
        batch_size=500)
    rnd_pca     = PCA(
        n_components=154,
        random_state=42,
        svd_solver="randomized")

    for pca in (regular_pca, inc_pca, rnd_pca):
        t1 = time.time()
        pca.fit(X_mnist)
        t2 = time.time()
        print(pca.__class__.__name__, t2 - t1, "seconds")
n_components = 2
PCA 1.308387279510498 seconds
IncrementalPCA 18.326093673706055 seconds
PCA 3.998342514038086 seconds
n_components = 10
PCA 1.4705824851989746 seconds
IncrementalPCA 16.598721742630005 seconds
PCA 4.156355619430542 seconds
n_components = 154
PCA 4.129154682159424 seconds
IncrementalPCA 16.597434043884277 seconds
PCA 4.0131142139434814 seconds
Randomized PCA
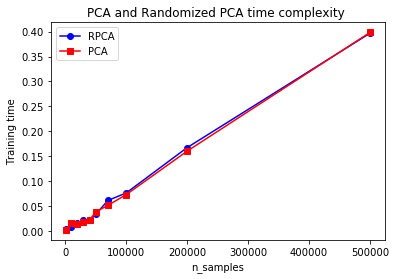
- Stochastic algorithm, quickly finds approximation of 1st d components. Dramatically faster.
rnd_pca = PCA(n_components=154, svd_solver="randomized")

t1 = time.time()
X_reduced = rnd_pca.fit_transform(X_mnist)
t2 = time.time()
print(t2-t1, "seconds")
4.414088487625122 seconds
Kernel PCA
- Use kernel trick to map instances into higher-D feature spaces. This enables non-linear classification & regression with SVMs.
- Good at preserving clusters after projecton.
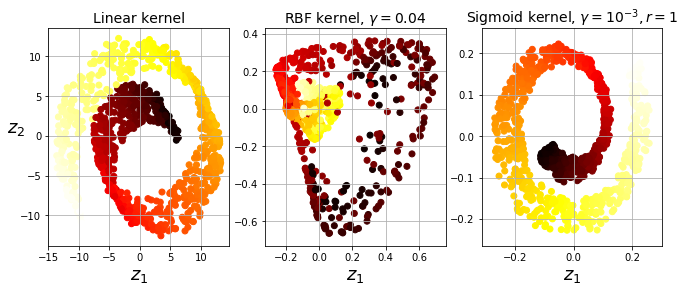
# Below: Swiss roll reduced to 2D using 3 techniques:
# 1) linear kernel (equiv to PCA)
# 2) RBF kernel
# 3) sigmoid kernel (logistic)

from sklearn.decomposition import KernelPCA

X, t = make_swiss_roll(
    n_samples=1000,
    noise=0.2,
    random_state=42)

lin_pca = KernelPCA(
    n_components = 2,
    kernel="linear",
    fit_inverse_transform=True)

rbf_pca = KernelPCA(
    n_components = 2,
    kernel="rbf",
    gamma=0.0433,
    fit_inverse_transform=True)

sig_pca = KernelPCA(
    n_components = 2,
    kernel="sigmoid",
    gamma=0.001,
    coef0=1,
    fit_inverse_transform=True)

y = t > 6.9

plt.figure(figsize=(11, 4))

for subplot, pca, title in (
    (131, lin_pca, "Linear kernel"),
    (132, rbf_pca, "RBF kernel, $\gamma=0.04$"),
    (133, sig_pca, "Sigmoid kernel, $\gamma=10^{-3}, r=1$")):

    X_reduced = pca.fit_transform(X)
    if subplot == 132:
        X_reduced_rbf = X_reduced

    plt.subplot(subplot)
    #plt.plot(X_reduced[y, 0], X_reduced[y, 1], "gs")
    #plt.plot(X_reduced[~y, 0], X_reduced[~y, 1], "y^")
    plt.title(title, fontsize=14)
    plt.scatter(X_reduced[:, 0], X_reduced[:, 1], c=t, cmap=plt.cm.hot)
    plt.xlabel("$z_1$", fontsize=18)
    if subplot == 131:
        plt.ylabel("$z_2$", fontsize=18, rotation=0)
    plt.grid(True)

#save_fig("kernel_pca_plot")
plt.show()
Selecting a Kernel & Hyperparameters
- Dimensionality reduction = prep for supervised learning task
- Can use grid search to select kernel & params
from sklearn.model_selection import GridSearchCV
from sklearn.linear_model import LogisticRegression
from sklearn.pipeline import Pipeline

clf = Pipeline([
    ("kpca", KernelPCA(n_components=2)),
    ("log_reg", LogisticRegression())])

param_grid = [{
    "kpca__gamma": np.linspace(0.03, 0.05, 10),
    "kpca__kernel": ["rbf", "sigmoid"]}]

grid_search = GridSearchCV(clf, param_grid, cv=3)
grid_search.fit(X, y)

# best kernel & params?
print(grid_search.best_params_)
{'kpca__gamma': 0.043333333333333335, 'kpca__kernel': 'rbf'}
- Another (unsupervised approach): select kernel & params with lowest reconstruction error. Not as easy as with linear PCA.
rbf_pca = KernelPCA(
    n_components = 2,
    kernel="rbf",
    gamma=0.0433,
    fit_inverse_transform=True) # perform reconstruction

X_reduced  = rbf_pca.fit_transform(X)
X_preimage = rbf_pca.inverse_transform(X_reduced)

# return reconstruction pre-image error
from sklearn.metrics import mean_squared_error
mean_squared_error(X, X_preimage)
32.786308795766082
times_rpca = []
times_pca = []
sizes = [1000, 10000,  20000,  30000, 40000, 50000, 70000,
              100000, 200000, 500000]

for n_samples in sizes:

    X = rnd.randn(n_samples, 5)

    pca = PCA(
        n_components = 2,
        random_state=42,
        svd_solver="randomized")

    t1 = time.time()
    pca.fit(X)
    t2 = time.time()
    times_rpca.append(t2 - t1)

    pca = PCA(n_components = 2)

    t1 = time.time()
    pca.fit(X)
    t2 = time.time()
    times_pca.append(t2 - t1)

plt.plot(sizes, times_rpca, "b-o", label="RPCA")
plt.plot(sizes, times_pca, "r-s", label="PCA")
plt.xlabel("n_samples")
plt.ylabel("Training time")
plt.legend(loc="upper left")
plt.title("PCA and Randomized PCA time complexity ")
plt.show()
LLE (Locally Linear Embedding)
- Powerful nonlinear dimensionality reduction tool
- Manifold Learning; doesn't rely on projections.
- LLE measures how each instance relates to closest neighbors, then looks for low-D representation where local relations are best preserved.
# Use LLE to unroll a Swiss Roll.

from sklearn.manifold import LocallyLinearEmbedding

X, t = make_swiss_roll(
    n_samples=1000,
    noise=0.2,
    random_state=41)

lle = LocallyLinearEmbedding(
    n_neighbors=10,
    n_components=2,
    random_state=42)

X_reduced = lle.fit_transform(X)

plt.title("Unrolled swiss roll using LLE", fontsize=14)
plt.scatter(X_reduced[:, 0], X_reduced[:, 1], c=t, cmap=plt.cm.hot)
plt.xlabel("$z_1$", fontsize=18)
plt.ylabel("$z_2$", fontsize=18)
plt.axis([-0.065, 0.055, -0.1, 0.12])
plt.grid(True)

#save_fig("lle_unrolling_plot")
plt.show()
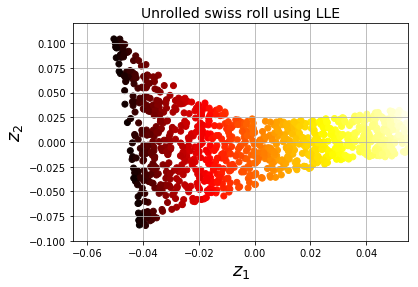
- 1st: For each instance, LLE finds k nearest neighbors & tries to reconstruct instance as linear function of neighbors (weights such that squared distance is minimum).
- Weight matrix W now encodes all local linear relations between instances.
- 2nd: Map instances into d-dimensional space & preserve relationship data
- Scikit computational complexity:
- finding K nearest neighbors: O(m x log(m) x n x log(k))
- weight optimization: O(m x n x k^3)
- constructing low-d representations: O(d x m^2)
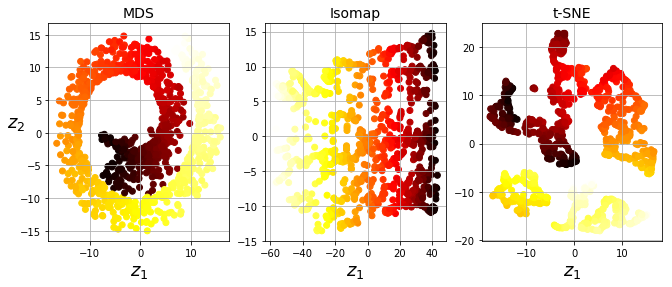
MDS, Isomap, t-SNE, LDA
from sklearn.manifold import MDS
mds = MDS(n_components=2, random_state=42)
X_reduced_mds = mds.fit_transform(X)
from sklearn.manifold import Isomap
isomap = Isomap(n_components=2)
X_reduced_isomap = isomap.fit_transform(X)
from sklearn.manifold import TSNE
tsne = TSNE(n_components=2)
X_reduced_tsne = tsne.fit_transform(X)
from sklearn.discriminant_analysis import LinearDiscriminantAnalysis
lda = LinearDiscriminantAnalysis(n_components=2)
X_mnist = mnist["data"]
y_mnist = mnist["target"]
lda.fit(X_mnist, y_mnist)
X_reduced_lda = lda.transform(X_mnist)
/home/bjpcjp/anaconda3/lib/python3.5/site-packages/sklearn/discriminant_analysis.py:387: UserWarning: Variables are collinear.
  warnings.warn("Variables are collinear.")
titles = ["MDS", "Isomap", "t-SNE"]

plt.figure(figsize=(11,4))

for subplot, title, X_reduced in zip((131, 132, 133), titles,
                                     (X_reduced_mds, X_reduced_isomap, X_reduced_tsne)):
    plt.subplot(subplot)
    plt.title(title, fontsize=14)
    plt.scatter(X_reduced[:, 0], X_reduced[:, 1], c=t, cmap=plt.cm.hot)
    plt.xlabel("$z_1$", fontsize=18)
    if subplot == 131:
        plt.ylabel("$z_2$", fontsize=18, rotation=0)
    plt.grid(True)

#save_fig("other_dim_reduction_plot")
plt.show()
