SVM Classification (Linear)
- Well suited for complex, small/medium dataset classification.
%matplotlib inline
import matplotlib.pyplot as plt
from sklearn.svm import SVC
from sklearn import datasets
iris = datasets.load_iris()
X = iris["data"][:, (2, 3)]
y = iris["target"]
setosa_or_versicolor = (y == 0) | (y == 1)
X = X[setosa_or_versicolor]
y = y[setosa_or_versicolor]
svm_clf = SVC(kernel="linear", C=float("inf"))
svm_clf.fit(X, y)
SVC(C=inf, cache_size=200, class_weight=None, coef0=0.0,
  decision_function_shape=None, degree=3, gamma='auto', kernel='linear',
  max_iter=-1, probability=False, random_state=None, shrinking=True,
  tol=0.001, verbose=False)
import numpy as np
x0 = np.linspace(0, 5.5, 200)
pred_1 = 5*x0 - 20
pred_2 = x0 - 1.8
pred_3 = 0.1 * x0 + 0.5
def plot_svc_decision_boundary(svm_clf, xmin, xmax):
w = svm_clf.coef_[0]
b = svm_clf.intercept_[0]
x0 = np.linspace(xmin, xmax, 200)
decision_boundary = -w[0]/w[1] * x0 - b/w[1]
margin = 1/w[1]
gutter_up = decision_boundary + margin
gutter_down = decision_boundary - margin
svs = svm_clf.support_vectors_
plt.scatter(svs[:, 0], svs[:, 1], s=180, facecolors='#FFAAAA')
plt.plot(x0, decision_boundary, "k-", linewidth=2)
plt.plot(x0, gutter_up, "k--", linewidth=2)
plt.plot(x0, gutter_down, "k--", linewidth=2)
plt.figure(figsize=(12,2.7))
plt.subplot(121)
plt.plot(x0, pred_1, "g--", linewidth=2)
plt.plot(x0, pred_2, "m-", linewidth=2)
plt.plot(x0, pred_3, "r-", linewidth=2)
plt.plot(X[:, 0][y==1], X[:, 1][y==1], "bs", label="Iris-Versicolor")
plt.plot(X[:, 0][y==0], X[:, 1][y==0], "yo", label="Iris-Setosa")
plt.xlabel("Petal length", fontsize=14)
plt.ylabel("Petal width", fontsize=14)
plt.legend(loc="upper left", fontsize=14)
plt.axis([0, 5.5, 0, 2])
plt.subplot(122)
plot_svc_decision_boundary(svm_clf, 0, 5.5)
plt.plot(X[:, 0][y==1], X[:, 1][y==1], "bs")
plt.plot(X[:, 0][y==0], X[:, 1][y==0], "yo")
plt.xlabel("Petal length", fontsize=14)
plt.axis([0, 5.5, 0, 2])
plt.show()

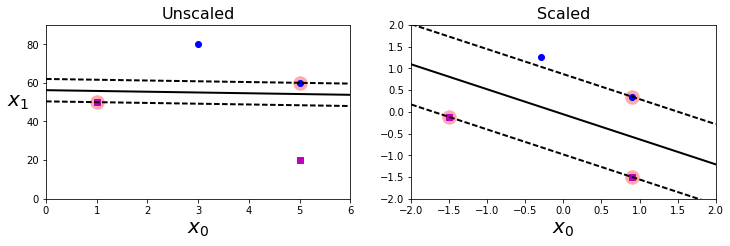
Xs = np.array([[1, 50], [5, 20], [3, 80], [5, 60]]).astype(np.float64)
ys = np.array([0, 0, 1, 1])
svm_clf = SVC(kernel="linear", C=100)
svm_clf.fit(Xs, ys)
plt.figure(figsize=(12,3.2))
plt.subplot(121)
plt.plot(Xs[:, 0][ys==1], Xs[:, 1][ys==1], "bo")
plt.plot(Xs[:, 0][ys==0], Xs[:, 1][ys==0], "ms")
plot_svc_decision_boundary(svm_clf, 0, 6)
plt.xlabel("$x_0$", fontsize=20)
plt.ylabel("$x_1$ ", fontsize=20, rotation=0)
plt.title("Unscaled", fontsize=16)
plt.axis([0, 6, 0, 90])
from sklearn.preprocessing import StandardScaler
scaler = StandardScaler()
X_scaled = scaler.fit_transform(Xs)
svm_clf.fit(X_scaled, ys)
plt.subplot(122)
plt.plot(X_scaled[:, 0][ys==1], X_scaled[:, 1][ys==1], "bo")
plt.plot(X_scaled[:, 0][ys==0], X_scaled[:, 1][ys==0], "ms")
plot_svc_decision_boundary(svm_clf, -2, 2)
plt.xlabel("$x_0$", fontsize=20)
plt.title("Scaled", fontsize=16)
plt.axis([-2, 2, -2, 2])
[-2, 2, -2, 2]
X_scaled
array([[-1.50755672, -0.11547005],
       [ 0.90453403, -1.5011107 ],
       [-0.30151134,  1.27017059],
       [ 0.90453403,  0.34641016]])
X_outliers = np.array([[3.4, 1.3], [3.2, 0.8]])
y_outliers = np.array([0, 0])
Xo1 = np.concatenate([X, X_outliers[:1]], axis=0)
yo1 = np.concatenate([y, y_outliers[:1]], axis=0)
Xo2 = np.concatenate([X, X_outliers[1:]], axis=0)
yo2 = np.concatenate([y, y_outliers[1:]], axis=0)
svm_clf2 = SVC(kernel="linear", C=10**9)
svm_clf2.fit(Xo2, yo2)
plt.figure(figsize=(12,2.7))
plt.subplot(121)
plt.plot(Xo1[:, 0][yo1==1], Xo1[:, 1][yo1==1], "bs")
plt.plot(Xo1[:, 0][yo1==0], Xo1[:, 1][yo1==0], "yo")
plt.text(0.3, 1.0, "Impossible!", fontsize=20, color="red")
plt.xlabel("Petal length", fontsize=14)
plt.ylabel("Petal width", fontsize=14)
plt.annotate("Outlier",
xy=(X_outliers[0][0], X_outliers[0][1]),
xytext=(2.5, 1.7),
ha="center",
arrowprops=dict(facecolor='black', shrink=0.1),
fontsize=16,
)
plt.axis([0, 5.5, 0, 2])
plt.subplot(122)
plt.plot(Xo2[:, 0][yo2==1], Xo2[:, 1][yo2==1], "bs")
plt.plot(Xo2[:, 0][yo2==0], Xo2[:, 1][yo2==0], "yo")
plot_svc_decision_boundary(svm_clf2, 0, 5.5)
plt.xlabel("Petal length", fontsize=14)
plt.annotate("Outlier",
xy=(X_outliers[1][0], X_outliers[1][1]),
xytext=(3.2, 0.08),
ha="center",
arrowprops=dict(facecolor='black', shrink=0.1),
fontsize=16,
)
plt.axis([0, 5.5, 0, 2])
[0, 5.5, 0, 2]

X_scaled
array([[-1.50755672, -0.11547005],
       [ 0.90453403, -1.5011107 ],
       [-0.30151134,  1.27017059],
       [ 0.90453403,  0.34641016]])
from sklearn import datasets
from sklearn.pipeline import Pipeline
from sklearn.preprocessing import StandardScaler
from sklearn.svm import LinearSVC
iris = datasets.load_iris()
X = iris["data"][:, (2, 3)]
y = (iris["target"] == 2).astype(np.float64)
scaler = StandardScaler()
svm_clf1 = LinearSVC(C=100, loss="hinge")
svm_clf2 = LinearSVC(C=1, loss="hinge")
scaled_svm_clf1 = Pipeline((
("scaler", scaler),
("linear_svc", svm_clf1),
))
scaled_svm_clf2 = Pipeline((
("scaler", scaler),
("linear_svc", svm_clf2),
))
scaled_svm_clf1.fit(X, y)
scaled_svm_clf2.fit(X, y)
scaled_svm_clf2.predict([[5.5, 1.7]])
array([ 1.])
X_scaled
array([[-1.50755672, -0.11547005],
       [ 0.90453403, -1.5011107 ],
       [-0.30151134,  1.27017059],
       [ 0.90453403,  0.34641016]])
b1 = svm_clf1.decision_function([-scaler.mean_ / scaler.scale_])
b2 = svm_clf2.decision_function([-scaler.mean_ / scaler.scale_])
w1 = svm_clf1.coef_[0] / scaler.scale_
w2 = svm_clf2.coef_[0] / scaler.scale_
svm_clf1.intercept_ = np.array([b1])
svm_clf2.intercept_ = np.array([b2])
svm_clf1.coef_ = np.array([w1])
svm_clf2.coef_ = np.array([w2])
t = y * 2 - 1
support_vectors_idx1 = (t * (X.dot(w1) + b1) < 1).ravel()
support_vectors_idx2 = (t * (X.dot(w2) + b2) < 1).ravel()
svm_clf1.support_vectors_ = X[support_vectors_idx1]
svm_clf2.support_vectors_ = X[support_vectors_idx2]
plt.figure(figsize=(12,3.2))
plt.subplot(121)
plt.plot(X[:, 0][y==1], X[:, 1][y==1], "g^", label="Iris-Virginica")
plt.plot(X[:, 0][y==0], X[:, 1][y==0], "bs", label="Iris-Versicolor")
plot_svc_decision_boundary(svm_clf1, 4, 6)
plt.xlabel("Petal length", fontsize=14)
plt.ylabel("Petal width", fontsize=14)
plt.legend(loc="upper left", fontsize=14)
plt.title("$C = {}$".format(svm_clf1.C), fontsize=16)
plt.axis([4, 6, 0.8, 2.8])

plt.subplot(122)
plt.plot(X[:, 0][y==1], X[:, 1][y==1], "g^")
plt.plot(X[:, 0][y==0], X[:, 1][y==0], "bs")
plot_svc_decision_boundary(svm_clf2, 4, 6)
plt.xlabel("Petal length", fontsize=14)
plt.title("$C = {}$".format(svm_clf2.C), fontsize=16)
plt.axis([4, 6, 0.8, 2.8])
[4, 6, 0.8, 2.8]

SVM Classification (Non-Linear)
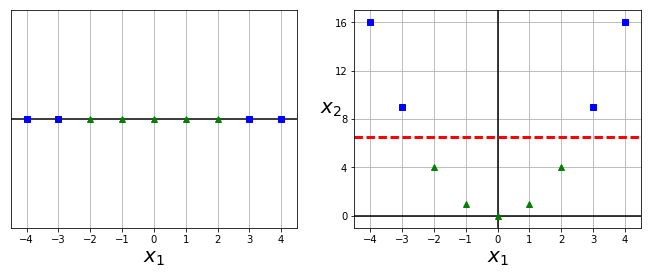
X1D = np.linspace(-4, 4, 9).reshape(-1, 1)
X2D = np.c_[X1D, X1D**2]
y = np.array([0, 0, 1, 1, 1, 1, 1, 0, 0])
plt.figure(figsize=(10, 4))
plt.subplot(121)
plt.grid(True, which='both')
plt.axhline(y=0, color='k')
plt.plot(X1D[:, 0][y==0], np.zeros(4), "bs")
plt.plot(X1D[:, 0][y==1], np.zeros(5), "g^")
plt.gca().get_yaxis().set_ticks([])
plt.xlabel(r"$x_1$", fontsize=20)
plt.axis([-4.5, 4.5, -0.2, 0.2])
plt.subplot(122)
plt.grid(True, which='both')
plt.axhline(y=0, color='k')
plt.axvline(x=0, color='k')
plt.plot(X2D[:, 0][y==0], X2D[:, 1][y==0], "bs")
plt.plot(X2D[:, 0][y==1], X2D[:, 1][y==1], "g^")
plt.xlabel(r"$x_1$", fontsize=20)
plt.ylabel(r"$x_2$", fontsize=20, rotation=0)
plt.gca().get_yaxis().set_ticks([0, 4, 8, 12, 16])
plt.plot([-4.5, 4.5], [6.5, 6.5], "r--", linewidth=3)
plt.axis([-4.5, 4.5, -1, 17])
plt.subplots_adjust(right=1)
plt.show()
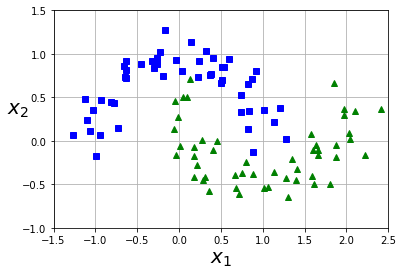
from sklearn.datasets import make_moons
X, y = make_moons(n_samples=100, noise=0.15, random_state=42)
def plot_dataset(X, y, axes):
plt.plot(X[:, 0][y==0], X[:, 1][y==0], "bs")
plt.plot(X[:, 0][y==1], X[:, 1][y==1], "g^")
plt.axis(axes)
plt.grid(True, which='both')
plt.xlabel(r"$x_1$", fontsize=20)
plt.ylabel(r"$x_2$", fontsize=20, rotation=0)
plot_dataset(X, y, [-1.5, 2.5, -1, 1.5])
plt.show()
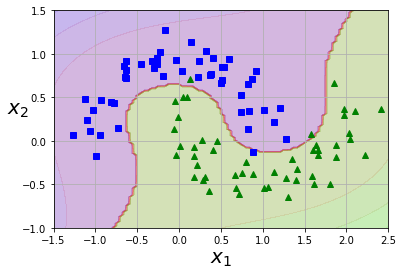
from sklearn.pipeline import Pipeline
from sklearn.preprocessing import PolynomialFeatures
polynomial_svm_clf = Pipeline((
("poly_features", PolynomialFeatures(degree=3)),
("scaler", StandardScaler()),
("svm_clf", LinearSVC(C=10, loss="hinge"))
))
polynomial_svm_clf.fit(X, y)
def plot_predictions(clf, axes):
x0s = np.linspace(axes[0], axes[1], 100)
x1s = np.linspace(axes[2], axes[3], 100)
x0, x1 = np.meshgrid(x0s, x1s)
X = np.c_[x0.ravel(), x1.ravel()]
y_pred = clf.predict(X).reshape(x0.shape)
y_decision = clf.decision_function(X).reshape(x0.shape)
plt.contourf(x0, x1, y_pred, cmap=plt.cm.brg, alpha=0.2)
plt.contourf(x0, x1, y_decision, cmap=plt.cm.brg, alpha=0.1)
plot_predictions(polynomial_svm_clf, [-1.5, 2.5, -1, 1.5])
plot_dataset(X, y, [-1.5, 2.5, -1, 1.5])
plt.show()
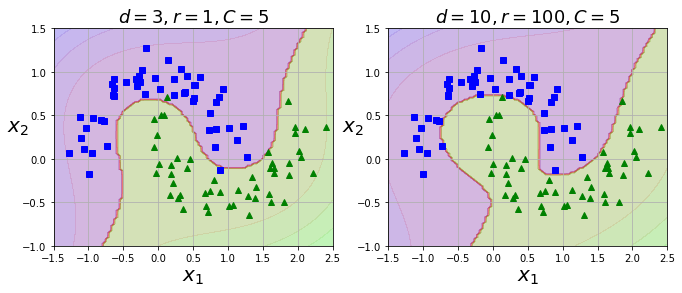
Solving polynomial-feature problems (aka combinatorial explosion) via the kernel trick
from sklearn.svm import SVC
poly_kernel_svm_clf = Pipeline((
("scaler", StandardScaler()),
("svm_clf", SVC(
kernel="poly", degree=3, coef0=1, C=5))))
poly100_kernel_svm_clf = Pipeline((
("scaler", StandardScaler()),
("svm_clf", SVC(kernel="poly", degree=10, coef0=100, C=5))
))
poly_kernel_svm_clf.fit(X, y)
poly100_kernel_svm_clf.fit(X, y)
plt.figure(figsize=(11, 4))
plt.subplot(121)
plot_predictions(poly_kernel_svm_clf, [-1.5, 2.5, -1, 1.5])
plot_dataset(X, y, [-1.5, 2.5, -1, 1.5])
plt.title(r"$d=3, r=1, C=5$", fontsize=18)
plt.subplot(122)
plot_predictions(poly100_kernel_svm_clf, [-1.5, 2.5, -1, 1.5])
plot_dataset(X, y, [-1.5, 2.5, -1, 1.5])
plt.title(r"$d=10, r=100, C=5$", fontsize=18)
plt.show()
Adding Similarity Features
- similarity function: measures how much an instance resembles specified landmark.
def gaussian_rbf(x, landmark, gamma):
return np.exp(-gamma * np.linalg.norm(x - landmark, axis=1)**2)
gamma = 0.3
x1s = np.linspace(-4.5, 4.5, 200).reshape(-1, 1)
x2s = gaussian_rbf(x1s, -2, gamma)
x3s = gaussian_rbf(x1s, 1, gamma)
XK = np.c_[gaussian_rbf(X1D, -2, gamma), gaussian_rbf(X1D, 1, gamma)]
yk = np.array([0, 0, 1, 1, 1, 1, 1, 0, 0])
plt.figure(figsize=(11, 4))
plt.subplot(121)
plt.grid(True, which='both')
plt.axhline(y=0, color='k')
plt.scatter(x=[-2, 1], y=[0, 0], s=150, alpha=0.5, c="red")
plt.plot(X1D[:, 0][yk==0], np.zeros(4), "bs")
plt.plot(X1D[:, 0][yk==1], np.zeros(5), "g^")
plt.plot(x1s, x2s, "g--")
plt.plot(x1s, x3s, "b:")
plt.gca().get_yaxis().set_ticks([0, 0.25, 0.5, 0.75, 1])
plt.xlabel(r"$x_1$", fontsize=20)
plt.ylabel(r"Similarity", fontsize=14)
plt.annotate(r'$\mathbf{x}$',
xy=(X1D[3, 0], 0),
xytext=(-0.5, 0.20),
ha="center",
arrowprops=dict(facecolor='black', shrink=0.1),
fontsize=18,
)
plt.text(-2, 0.9, "$x_2$", ha="center", fontsize=20)
plt.text(1, 0.9, "$x_3$", ha="center", fontsize=20)
plt.axis([-4.5, 4.5, -0.1, 1.1])
plt.subplot(122)
plt.grid(True, which='both')
plt.axhline(y=0, color='k')
plt.axvline(x=0, color='k')
plt.plot(XK[:, 0][yk==0], XK[:, 1][yk==0], "bs")
plt.plot(XK[:, 0][yk==1], XK[:, 1][yk==1], "g^")
plt.xlabel(r"$x_2$", fontsize=20)
plt.ylabel(r"$x_3$ ", fontsize=20, rotation=0)
plt.annotate(r'$\phi\left(\mathbf{x}\right)$',
xy=(XK[3, 0], XK[3, 1]),
xytext=(0.65, 0.50),
ha="center",
arrowprops=dict(facecolor='black', shrink=0.1),
fontsize=18,
)
plt.plot([-0.1, 1.1], [0.57, -0.1], "r--", linewidth=3)
plt.axis([-0.1, 1.1, -0.1, 1.1])
plt.subplots_adjust(right=1)
plt.show()
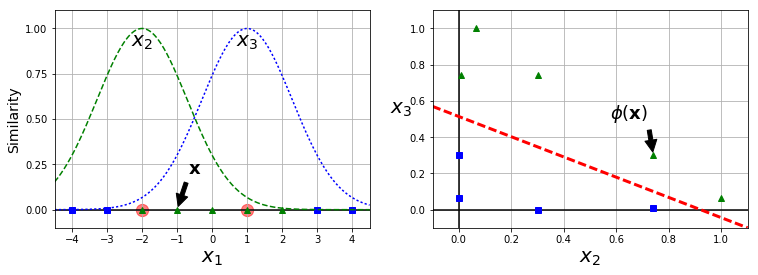
x1_example = X1D[3, 0]
for landmark in (-2, 1):
    k = gaussian_rbf(np.array([[x1_example]]), np.array([[landmark]]), gamma)
    print("Phi({}, {}) = {}".format(x1_example, landmark, k))
Phi(-1.0, -2) = [ 0.74081822]
Phi(-1.0, 1) = [ 0.30119421]
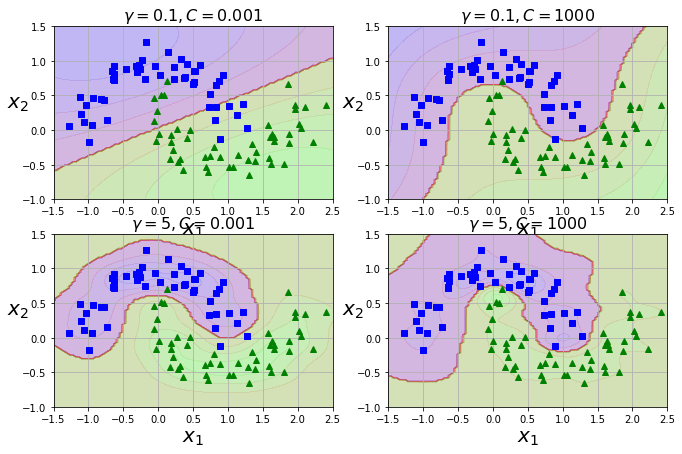
Using a Gaussian RBF Kernel
rbf_kernel_svm_clf = Pipeline((
("scaler", StandardScaler()),
("svm_clf", SVC(kernel="rbf", gamma=5, C=0.001))
))
rbf_kernel_svm_clf.fit(X, y)
from sklearn.svm import SVC
gamma1, gamma2 = 0.1, 5
C1, C2 = 0.001, 1000
hyperparams = (gamma1, C1), (gamma1, C2), (gamma2, C1), (gamma2, C2)
svm_clfs = []
for gamma, C in hyperparams:
rbf_kernel_svm_clf = Pipeline((
("scaler", StandardScaler()),
("svm_clf", SVC(kernel="rbf", gamma=gamma, C=C))
))
rbf_kernel_svm_clf.fit(X, y)
svm_clfs.append(rbf_kernel_svm_clf)
plt.figure(figsize=(11, 7))
for i, svm_clf in enumerate(svm_clfs):
plt.subplot(221 + i)
plot_predictions(svm_clf, [-1.5, 2.5, -1, 1.5])
plot_dataset(X, y, [-1.5, 2.5, -1, 1.5])
gamma, C = hyperparams[i]
plt.title(r"$\gamma = {}, C = {}$".format(gamma, C), fontsize=16)
plt.show()
Computational Complexity
- LinearSVC class: based on liblinear library. Doesn't support kernel trick. Scales linearly to #instances and #features; training complexity ~O(mxn).
- SVC class: based on libsvm library. Does support kernel trick. Training complexity is O(m^2xn) to O(m^3xn) = MUCH slower on larger training datasets.
SVM Regression (Linear & Non-Linear)
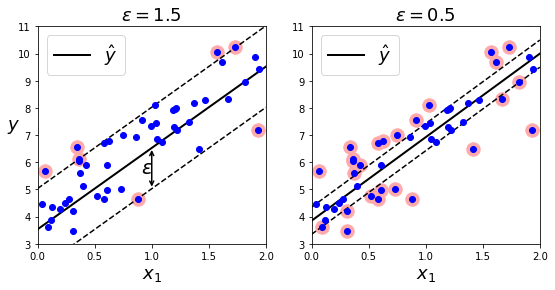
- Objectives: 1) fit max #instances on the street; 2) find min #margin violations (instances "off" the street").
- Width controlled by epsilon hyperparameter.
- Below: random linear dataset. two training results with different vals of epsilon.
from sklearn.svm import LinearSVR
import numpy.random as rnd

rnd.seed(42)
m = 50
X = 2 * rnd.rand(m, 1)
y = (4 + 3 * X + rnd.randn(m, 1)).ravel()

svm_reg1 = LinearSVR(epsilon=1.5)
svm_reg2 = LinearSVR(epsilon=0.5)
svm_reg1.fit(X, y)
svm_reg2.fit(X, y)

def find_support_vectors(svm_reg, X, y):
    y_pred = svm_reg.predict(X)
    off_margin = (np.abs(y - y_pred) >= svm_reg.epsilon)
    return np.argwhere(off_margin)

svm_reg1.support_ = find_support_vectors(svm_reg1, X, y)
svm_reg2.support_ = find_support_vectors(svm_reg2, X, y)

eps_x1 = 1
eps_y_pred = svm_reg1.predict([[eps_x1]])
def plot_svm_regression(svm_reg, X, y, axes):
x1s = np.linspace(axes[0], axes[1], 100).reshape(100, 1)
y_pred = svm_reg.predict(x1s)
plt.plot(x1s, y_pred, "k-", linewidth=2, label=r"$\hat{y}$")
plt.plot(x1s, y_pred + svm_reg.epsilon, "k--")
plt.plot(x1s, y_pred - svm_reg.epsilon, "k--")
plt.scatter(X[svm_reg.support_], y[svm_reg.support_], s=180, facecolors='#FFAAAA')
plt.plot(X, y, "bo")
plt.xlabel(r"$x_1$", fontsize=18)
plt.legend(loc="upper left", fontsize=18)
plt.axis(axes)
plt.figure(figsize=(9, 4))
plt.subplot(121)
plot_svm_regression(svm_reg1, X, y, [0, 2, 3, 11])
plt.title(r"$\epsilon = {}$".format(svm_reg1.epsilon), fontsize=18)
plt.ylabel(r"$y$", fontsize=18, rotation=0)
plt.annotate(
'', xy=(eps_x1, eps_y_pred), xycoords='data',
xytext=(eps_x1, eps_y_pred - svm_reg1.epsilon),
textcoords='data', arrowprops={'arrowstyle': '<->', 'linewidth': 1.5}
)
plt.text(0.91, 5.6, r"$\epsilon$", fontsize=20)
plt.subplot(122)
plot_svm_regression(svm_reg2, X, y, [0, 2, 3, 11])
plt.title(r"$\epsilon = {}$".format(svm_reg2.epsilon), fontsize=18)
plt.show()
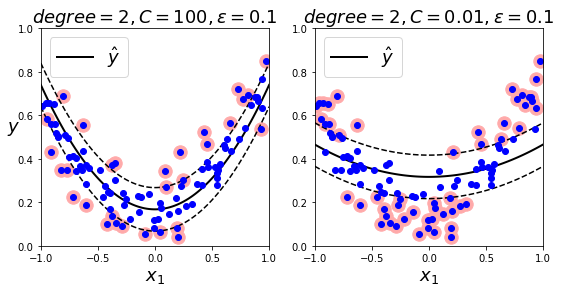
from sklearn.svm import SVR
rnd.seed(42)
m = 100
X = 2 * rnd.rand(m, 1) - 1
y = (0.2 + 0.1 * X + 0.5 * X**2 + rnd.randn(m, 1)/10).ravel()
svm_poly_reg1 = SVR(kernel="poly", degree=2, C=100, epsilon=0.1)
svm_poly_reg2 = SVR(kernel="poly", degree=2, C=0.01, epsilon=0.1)
svm_poly_reg1.fit(X, y)
svm_poly_reg2.fit(X, y)
SVR(C=0.01, cache_size=200, coef0=0.0, degree=2, epsilon=0.1, gamma='auto',
  kernel='poly', max_iter=-1, shrinking=True, tol=0.001, verbose=False)
plt.figure(figsize=(9, 4))
plt.subplot(121)
plot_svm_regression(svm_poly_reg1, X, y, [-1, 1, 0, 1])
plt.title(r"$degree={}, C={}, \epsilon = {}$".format(svm_poly_reg1.degree, svm_poly_reg1.C, svm_poly_reg1.epsilon), fontsize=18)
plt.ylabel(r"$y$", fontsize=18, rotation=0)
plt.subplot(122)
plot_svm_regression(svm_poly_reg2, X, y, [-1, 1, 0, 1])
plt.title(r"$degree={}, C={}, \epsilon = {}$".format(svm_poly_reg2.degree, svm_poly_reg2.C, svm_poly_reg2.epsilon), fontsize=18)
plt.show()
Under the Hood
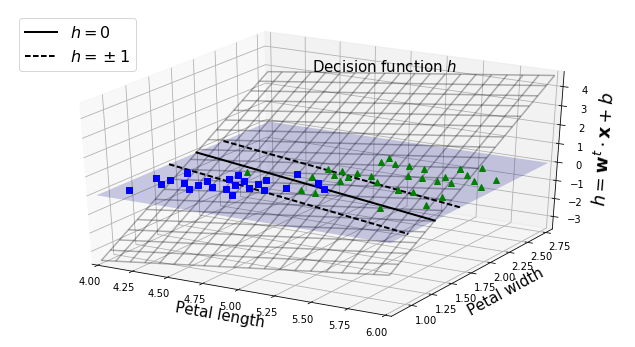
- conventions: b = bias term; w = feature weights vector.
iris = datasets.load_iris()
X = iris["data"][:, (2, 3)]
y = (iris["target"] == 2).astype(np.float64)
from mpl_toolkits.mplot3d import Axes3D
def plot_3D_decision_function(ax, w, b, x1_lim=[4, 6], x2_lim=[0.8, 2.8]):
x1_in_bounds = (X[:, 0] > x1_lim[0]) & (X[:, 0] < x1_lim[1])
X_crop = X[x1_in_bounds]
y_crop = y[x1_in_bounds]
x1s = np.linspace(x1_lim[0], x1_lim[1], 20)
x2s = np.linspace(x2_lim[0], x2_lim[1], 20)
x1, x2 = np.meshgrid(x1s, x2s)
xs = np.c_[x1.ravel(), x2.ravel()]
df = (xs.dot(w) + b).reshape(x1.shape)
m = 1 / np.linalg.norm(w)
boundary_x2s = -x1s*(w[0]/w[1])-b/w[1]
margin_x2s_1 = -x1s*(w[0]/w[1])-(b-1)/w[1]
margin_x2s_2 = -x1s*(w[0]/w[1])-(b+1)/w[1]
ax.plot_surface(x1s, x2, 0, color="b", alpha=0.2, cstride=100, rstride=100)
ax.plot(x1s, boundary_x2s, 0, "k-", linewidth=2, label=r"$h=0$")
ax.plot(x1s, margin_x2s_1, 0, "k--", linewidth=2, label=r"$h=\pm 1$")
ax.plot(x1s, margin_x2s_2, 0, "k--", linewidth=2)
ax.plot(X_crop[:, 0][y_crop==1], X_crop[:, 1][y_crop==1], 0, "g^")
ax.plot_wireframe(x1, x2, df, alpha=0.3, color="k")
ax.plot(X_crop[:, 0][y_crop==0], X_crop[:, 1][y_crop==0], 0, "bs")
ax.axis(x1_lim + x2_lim)
ax.text(4.5, 2.5, 3.8, "Decision function $h$", fontsize=15)
ax.set_xlabel(r"Petal length", fontsize=15)
ax.set_ylabel(r"Petal width", fontsize=15)
ax.set_zlabel(r"$h = \mathbf{w}^t \cdot \mathbf{x} + b$", fontsize=18)
ax.legend(loc="upper left", fontsize=16)
fig = plt.figure(figsize=(11, 6))
ax1 = fig.add_subplot(111, projection='3d')
plot_3D_decision_function(ax1, w=svm_clf2.coef_[0], b=svm_clf2.intercept_[0])
plt.show()
Training Objectives
- Slope of a decision function equals a weight vector's norm (||w||)
- Divide slope by 2 ==> any points where decision function = +1/-1 will be 2x away from decision boundary.

- So we want minimal ||w|| to get max margins
- If we also want zero margin violations, then decision function needs to be GT1 (positive) and LT1 (negative).
- if soft margins OK - need to define a slack variable (C) for tradeoff.
Quadratic programming
- Hard- & soft-margin problems = convex quadratic optimization problems with linear constraints, ie quadratic programming (QP) problems. See Convex Optimization for more info.
todo: The dual problem
todo: Kernelized SVM
todo: Online (incremental learning) SVMs
- Linear SVM classifiers often use SGD to find a min-cost solution. SGD converges much more slowly than QP-based methods.
- implementation:
- implementation:


