"""
Linear Regression with TensorFlow
[email protected]
"""
import tensorflow as tf
import numpy as np
import matplotlib.pyplot as plt
%matplotlib inline
print ("Packages Loaded")
Packages Loaded
np.random.seed(1)
def f(x, a, b):
n = train_X.size
vals = np.zeros((1, n))
for i in range(0, n):
ax = np.multiply(a, x.item(i))
val = np.add(ax, b)
vals[0, i] = val
return vals
Wref = 0.7
bref = -1.
n = 20
noise_var = 0.001
train_X = np.random.random((1, n))
ref_Y = f(train_X, Wref, bref)
train_Y = ref_Y + np.sqrt(noise_var)*np.random.randn(1, n)
n_samples = train_X.size
print ("")
print (" Type of 'train_X' is ", type(train_X))
print (" Shape of 'train_X' is %s" % (train_X.shape,))
print (" Type of 'train_Y' is ", type(train_Y))
print (" Shape of 'train_Y' is %s" % (train_Y.shape,))
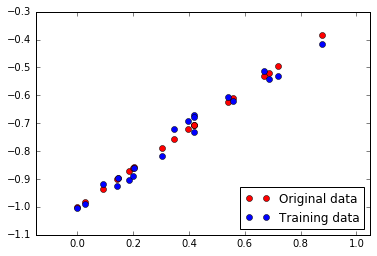
plt.figure(1)
plt.plot(train_X[0, :], ref_Y[0, :], 'ro', label='Original data')
plt.plot(train_X[0, :], train_Y[0, :], 'bo', label='Training data')
plt.axis('equal')
plt.legend(loc='lower right')
 Type of 'train_X' is  <class 'numpy.ndarray'>
 Shape of 'train_X' is (1, 20)
 Type of 'train_Y' is  <class 'numpy.ndarray'>
 Shape of 'train_Y' is (1, 20)


<matplotlib.legend.Legend at 0x7ff521bd5f60>

training_epochs = 2000
display_step = 50
X = tf.placeholder(tf.float32, name="input")
Y = tf.placeholder(tf.float32, name="output")
W = tf.Variable(np.random.randn(), name="weight")
b = tf.Variable(np.random.randn(), name="bias")
activation = tf.add(tf.mul(X, W), b)
learning_rate = 0.01
cost = tf.reduce_mean(tf.pow(activation-Y, 2))
optimizer = tf.train.GradientDescentOptimizer(learning_rate).minimize(cost)
"""
tf.reduce_sum()
tf.reduce_mean()
_____
tf.pow(Yhat, Y, 2)
tf.nn.softmax_cross_entropy_with_logits(Yhat, Y)
_____
tf.train.GradientDescentOptimizer(0.05).minimize(cost)
tf.train.RMSPropOptimizer(0.001, 0.9).minimize(cost)
"""
init = tf.initialize_all_variables()
sess = tf.Session()
sess.run(init)
for epoch in range(training_epochs):
for (x, y) in zip(train_X[0, :], train_Y[0, :]):
sess.run(optimizer, feed_dict={X:x, Y:y})
if epoch % display_step == 0:
costval = sess.run(cost, feed_dict={X: train_X, Y:train_Y})
print ("Epoch:", "%04d"%(epoch+1), "cost=", "{:.5f}".format(costval))
Wtemp = sess.run(W)
btemp = sess.run(b)
print (" Wtemp is", "{:.4f}".format(Wtemp), "btemp is", "{:.4f}".format(btemp))
print (" Wref is", "{:.4f}".format(Wref), "bref is", "{:.4f}".format(bref))
Wopt = sess.run(W)
bopt = sess.run(b)
fopt = f(train_X, Wopt, bopt)
Epoch: 0001 cost= 0.21532
 Wtemp is -0.6964 btemp is -0.1715
 Wref is 0.7000 bref is -1.0000
Epoch: 0051 cost= 0.01696
 Wtemp is 0.1656 btemp is -0.7954
 Wref is 0.7000 bref is -1.0000
Epoch: 0101 cost= 0.00264
 Wtemp is 0.5047 btemp is -0.9280
 Wref is 0.7000 bref is -1.0000
Epoch: 0151 cost= 0.00083
 Wtemp is 0.6247 btemp is -0.9750
 Wref is 0.7000 bref is -1.0000
Epoch: 0201 cost= 0.00060
 Wtemp is 0.6672 btemp is -0.9916
 Wref is 0.7000 bref is -1.0000
Epoch: 0251 cost= 0.00057
 Wtemp is 0.6823 btemp is -0.9975
 Wref is 0.7000 bref is -1.0000
Epoch: 0301 cost= 0.00057
 Wtemp is 0.6876 btemp is -0.9996
 Wref is 0.7000 bref is -1.0000
Epoch: 0351 cost= 0.00056
 Wtemp is 0.6895 btemp is -1.0003
 Wref is 0.7000 bref is -1.0000
Epoch: 0401 cost= 0.00056
 Wtemp is 0.6901 btemp is -1.0006
 Wref is 0.7000 bref is -1.0000
Epoch: 0451 cost= 0.00056
 Wtemp is 0.6904 btemp is -1.0007
 Wref is 0.7000 bref is -1.0000
Epoch: 0501 cost= 0.00056
 Wtemp is 0.6905 btemp is -1.0007
 Wref is 0.7000 bref is -1.0000
Epoch: 0551 cost= 0.00056
 Wtemp is 0.6905 btemp is -1.0007
 Wref is 0.7000 bref is -1.0000
Epoch: 0601 cost= 0.00056
 Wtemp is 0.6905 btemp is -1.0007
 Wref is 0.7000 bref is -1.0000
Epoch: 0651 cost= 0.00056
 Wtemp is 0.6905 btemp is -1.0007
 Wref is 0.7000 bref is -1.0000
Epoch: 0701 cost= 0.00056
 Wtemp is 0.6905 btemp is -1.0007
 Wref is 0.7000 bref is -1.0000
Epoch: 0751 cost= 0.00056
 Wtemp is 0.6905 btemp is -1.0007
 Wref is 0.7000 bref is -1.0000
Epoch: 0801 cost= 0.00056
 Wtemp is 0.6905 btemp is -1.0007
 Wref is 0.7000 bref is -1.0000
Epoch: 0851 cost= 0.00056
 Wtemp is 0.6905 btemp is -1.0007
 Wref is 0.7000 bref is -1.0000
Epoch: 0901 cost= 0.00056
 Wtemp is 0.6905 btemp is -1.0007
 Wref is 0.7000 bref is -1.0000
Epoch: 0951 cost= 0.00056
 Wtemp is 0.6905 btemp is -1.0007
 Wref is 0.7000 bref is -1.0000
Epoch: 1001 cost= 0.00056
 Wtemp is 0.6905 btemp is -1.0007
 Wref is 0.7000 bref is -1.0000
Epoch: 1051 cost= 0.00056
 Wtemp is 0.6905 btemp is -1.0007
 Wref is 0.7000 bref is -1.0000
Epoch: 1101 cost= 0.00056
 Wtemp is 0.6905 btemp is -1.0007
 Wref is 0.7000 bref is -1.0000
Epoch: 1151 cost= 0.00056
 Wtemp is 0.6905 btemp is -1.0007
 Wref is 0.7000 bref is -1.0000
Epoch: 1201 cost= 0.00056
 Wtemp is 0.6905 btemp is -1.0007
 Wref is 0.7000 bref is -1.0000
Epoch: 1251 cost= 0.00056
 Wtemp is 0.6905 btemp is -1.0007
 Wref is 0.7000 bref is -1.0000
Epoch: 1301 cost= 0.00056
 Wtemp is 0.6905 btemp is -1.0007
 Wref is 0.7000 bref is -1.0000
Epoch: 1351 cost= 0.00056
 Wtemp is 0.6905 btemp is -1.0007
 Wref is 0.7000 bref is -1.0000
Epoch: 1401 cost= 0.00056
 Wtemp is 0.6905 btemp is -1.0007
 Wref is 0.7000 bref is -1.0000
Epoch: 1451 cost= 0.00056
 Wtemp is 0.6905 btemp is -1.0007
 Wref is 0.7000 bref is -1.0000
Epoch: 1501 cost= 0.00056
 Wtemp is 0.6905 btemp is -1.0007
 Wref is 0.7000 bref is -1.0000
Epoch: 1551 cost= 0.00056
 Wtemp is 0.6905 btemp is -1.0007
 Wref is 0.7000 bref is -1.0000
Epoch: 1601 cost= 0.00056
 Wtemp is 0.6905 btemp is -1.0007
 Wref is 0.7000 bref is -1.0000
Epoch: 1651 cost= 0.00056
 Wtemp is 0.6905 btemp is -1.0007
 Wref is 0.7000 bref is -1.0000
Epoch: 1701 cost= 0.00056
 Wtemp is 0.6905 btemp is -1.0007
 Wref is 0.7000 bref is -1.0000
Epoch: 1751 cost= 0.00056
 Wtemp is 0.6905 btemp is -1.0007
 Wref is 0.7000 bref is -1.0000
Epoch: 1801 cost= 0.00056
 Wtemp is 0.6905 btemp is -1.0007
 Wref is 0.7000 bref is -1.0000
Epoch: 1851 cost= 0.00056
 Wtemp is 0.6905 btemp is -1.0007
 Wref is 0.7000 bref is -1.0000
Epoch: 1901 cost= 0.00056
 Wtemp is 0.6905 btemp is -1.0007
 Wref is 0.7000 bref is -1.0000
Epoch: 1951 cost= 0.00056
 Wtemp is 0.6905 btemp is -1.0007
 Wref is 0.7000 bref is -1.0000
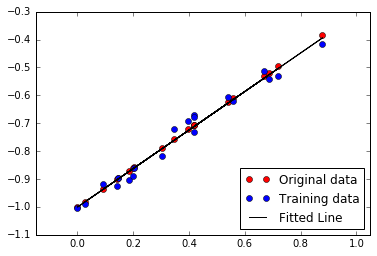
plt.figure(2)
plt.plot(train_X[0, :], ref_Y[0, :], 'ro', label='Original data')
plt.plot(train_X[0, :], train_Y[0, :], 'bo', label='Training data')
plt.plot(train_X[0, :], fopt[0, :], 'k-', label='Fitted Line')
plt.axis('equal')
plt.legend(loc='lower right')
<matplotlib.legend.Legend at 0x7ff520245b00>


