Highcharts 标示区曲线图
以下实例演示了标示区曲线图。
我们在前面的章节已经了解了 Highcharts 配置语法。接下来让我们来看下如何配置。
配置
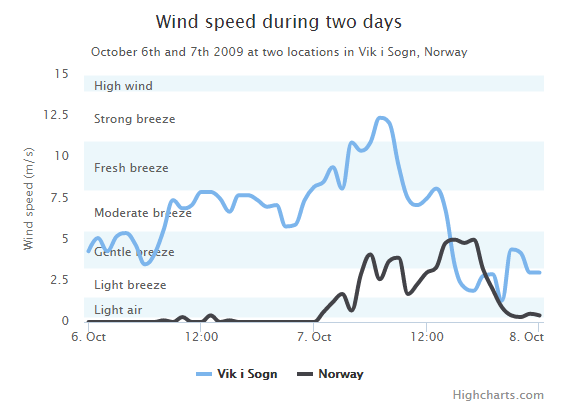
使用 yAxis.plotBands 属性来配置标示区。区间范围使用 'from' 和 'to' 属性。颜色设置使用 'color' 属性。标签样式使用 'label' 属性。
配置信息:
var yAxis = { title: { text: 'Wind speed (m/s)' }, min: 0, minorGridLineWidth: 0, gridLineWidth: 0, alternateGridColor: null, plotBands: [{ // Light air from: 0.3, to: 1.5, color: 'rgba(68, 170, 213, 0.1)', label: { text: 'Light air', style: { color: '#606060' } } }, { // Light breeze from: 1.5, to: 3.3, color: 'rgba(0, 0, 0, 0)', label: { text: 'Light breeze', style: { color: '#606060' } } }, { // Gentle breeze from: 3.3, to: 5.5, color: 'rgba(68, 170, 213, 0.1)', label: { text: 'Gentle breeze', style: { color: '#606060' } } }, { // Moderate breeze from: 5.5, to: 8, color: 'rgba(0, 0, 0, 0)', label: { text: 'Moderate breeze', style: { color: '#606060' } } }, { // Fresh breeze from: 8, to: 11, color: 'rgba(68, 170, 213, 0.1)', label: { text: 'Fresh breeze', style: { color: '#606060' } } }, { // Strong breeze from: 11, to: 14, color: 'rgba(0, 0, 0, 0)', label: { text: 'Strong breeze', style: { color: '#606060' } } }, { // High wind from: 14, to: 15, color: 'rgba(68, 170, 213, 0.1)', label: { text: 'High wind', style: { color: '#606060' } } }] };
实例
文件名:highcharts_spline_bands.htm
<html> <head> <title>Highcharts 教程 | 菜鸟教程(runoob.com)</title> <script src="http://apps.bdimg.com/libs/jquery/2.1.4/jquery.min.js"></script> <script src="/try/demo_source/highcharts.js"></script> </head> <body> <div id="container" style="width: 550px; height: 400px; margin: 0 auto"></div> <script language="JavaScript"> $(document).ready(function() { var chart = { type: 'spline' }; var title = { text: 'Wind speed during two days' }; var subtitle = { text: 'October 6th and 7th 2009 at two locations in Vik i Sogn, Norway' }; var xAxis = { type: 'datetime', labels: { overflow: 'justify' } }; var yAxis = { title: { text: 'Wind speed (m/s)' }, min: 0, minorGridLineWidth: 0, gridLineWidth: 0, alternateGridColor: null, plotBands: [{ // Light air from: 0.3, to: 1.5, color: 'rgba(68, 170, 213, 0.1)', label: { text: 'Light air', style: { color: '#606060' } } }, { // Light breeze from: 1.5, to: 3.3, color: 'rgba(0, 0, 0, 0)', label: { text: 'Light breeze', style: { color: '#606060' } } }, { // Gentle breeze from: 3.3, to: 5.5, color: 'rgba(68, 170, 213, 0.1)', label: { text: 'Gentle breeze', style: { color: '#606060' } } }, { // Moderate breeze from: 5.5, to: 8, color: 'rgba(0, 0, 0, 0)', label: { text: 'Moderate breeze', style: { color: '#606060' } } }, { // Fresh breeze from: 8, to: 11, color: 'rgba(68, 170, 213, 0.1)', label: { text: 'Fresh breeze', style: { color: '#606060' } } }, { // Strong breeze from: 11, to: 14, color: 'rgba(0, 0, 0, 0)', label: { text: 'Strong breeze', style: { color: '#606060' } } }, { // High wind from: 14, to: 15, color: 'rgba(68, 170, 213, 0.1)', label: { text: 'High wind', style: { color: '#606060' } } }] }; var tooltip = { valueSuffix: ' m/s' }; var plotOptions = { spline: { lineWidth: 4, states: { hover: { lineWidth: 5 } }, marker: { enabled: false }, pointInterval: 3600000, // one hour pointStart: Date.UTC(2009, 9, 6, 0, 0, 0) } }; var series= [{ name: 'Vik i Sogn', data: [4.3, 5.1, 4.3, 5.2, 5.4, 4.7, 3.5, 4.1, 5.6, 7.4, 6.9, 7.1, 7.9, 7.9, 7.5, 6.7, 7.7, 7.7, 7.4, 7.0, 7.1, 5.8, 5.9, 7.4, 8.2, 8.5, 9.4, 8.1, 10.9, 10.4, 10.9, 12.4, 12.1, 9.5, 7.5, 7.1, 7.5, 8.1, 6.8, 3.4, 2.1, 1.9, 2.8, 2.9, 1.3, 4.4, 4.2, 3.0, 3.0] }, { name: 'Norway', data: [0.0, 0.0, 0.0, 0.0, 0.0, 0.0, 0.0, 0.0, 0.1, 0.0, 0.3, 0.0, 0.0, 0.4, 0.0, 0.1, 0.0, 0.0, 0.0, 0.0, 0.0, 0.0, 0.0, 0.0, 0.0, 0.6, 1.2, 1.7, 0.7, 2.9, 4.1, 2.6, 3.7, 3.9, 1.7, 2.3, 3.0, 3.3, 4.8, 5.0, 4.8, 5.0, 3.2, 2.0, 0.9, 0.4, 0.3, 0.5, 0.4] }]; var navigation = { menuItemStyle: { fontSize: '10px' } } var json = {}; json.chart = chart; json.title = title; json.subtitle = subtitle; json.tooltip = tooltip; json.xAxis = xAxis; json.yAxis = yAxis; json.series = series; json.plotOptions = plotOptions; json.navigation = navigation; $('#container').highcharts(json); }); </script> </body> </html>
以上实例输出结果为: