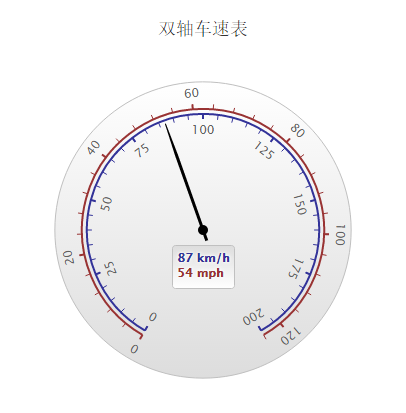
Highcharts 双轴车速表
以下实例演示了双轴车速表。
我们在前面的章节已经了解了 Highcharts 基本配置语法。接下来让我们来看下其他的配置。
配置
chart.type 配置
配置 chart 的 type 为 'gauge' 。chart.type 描述了图表类型。默认值为 "line"。
var chart = { type: 'gauge' };
pane 配置
pane 只适用在极坐标图和角度测量仪。此可配置对象持有组合x轴和y周的常规选项。每个x轴和y轴都可以通过索引关联到窗格中。
var pane = { startAngle: -150, // x轴或测量轴的开始度数,以度数的方式给出。0是北 endAngle: 150 //x轴极坐标或角度轴的最终度数,以度数的方式给出。0是北 };
实例
文件名:highcharts_guage_dualaxes.htm
<html> <head> <title>Highcharts 教程 | 菜鸟教程(runoob.com)</title> <script src="http://apps.bdimg.com/libs/jquery/2.1.4/jquery.min.js"></script> <script src="/try/demo_source/highcharts.js"></script> <script src="/try/demo_source/highcharts-more.js"></script> </head> <body> <div id="container" style="width: 550px; height: 400px; margin: 0 auto"></div> <script language="JavaScript"> $(document).ready(function() { var chart = { type: 'gauge', plotBackgroundColor: null, plotBackgroundImage: null, plotBorderWidth: 0, plotShadow: false }; var credits = { enabled: false }; var title = { text: '双轴车速表' }; var pane = { startAngle: -150, endAngle: 150 }; // the value axis var yAxis = [{ min: 0, max: 200, lineColor: '#339', tickColor: '#339', minorTickColor: '#339', offset: -25, lineWidth: 2, labels: { distance: -20, rotation: 'auto' }, tickLength: 5, minorTickLength: 5, endOnTick: false }, { min: 0, max: 124, tickPosition: 'outside', lineColor: '#933', lineWidth: 2, minorTickPosition: 'outside', tickColor: '#933', minorTickColor: '#933', tickLength: 5, minorTickLength: 5, labels: { distance: 12, rotation: 'auto' }, offset: -20, endOnTick: false }]; var series= [{ name: 'Speed', data: [80], dataLabels: { formatter: function () { var kmh = this.y, mph = Math.round(kmh * 0.621); return '<span style="color:#339">' + kmh + ' km/h</span><br/>' + '<span style="color:#933">' + mph + ' mph</span>'; }, backgroundColor: { linearGradient: { x1: 0, y1: 0, x2: 0, y2: 1 }, stops: [ [0, '#DDD'], [1, '#FFF'] ] } }, tooltip: { valueSuffix: ' km/h' } }]; var json = {}; json.chart = chart; json.credits = credits; json.title = title; json.pane = pane; json.yAxis = yAxis; json.series = series; // Add some life var chartFunction = function (chart) { setInterval(function () { var point = chart.series[0].points[0], newVal, inc = Math.round((Math.random() - 0.5) * 20); newVal = point.y + inc; if (newVal < 0 || newVal > 200) { newVal = point.y - inc; } point.update(newVal); }, 3000); }; $('#container').highcharts(json, chartFunction); }); </script> </body> </html>
以上实例输出结果为: