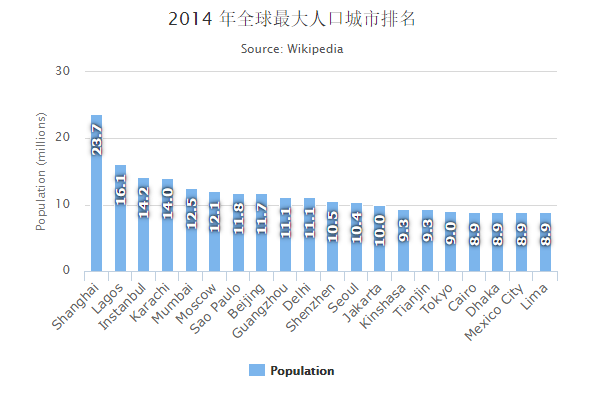
Highcharts 标签旋转柱形图
以下实例演示了标签旋转柱形图。
我们在前面的章节已经了解了 Highcharts 基本配置语法。接下来让我们来看下其他的配置。在 dataLabels 中添加 rotation 属性:
配置
dataLabels : 数据标签
dataLabels 定义图上是否显示数据标签。
文本旋转程度由 rotation 属性决定。我们还可以通过其他属性来定义文本标签的背景,间隔,边框等。
dataLabels = { enabled: true, rotation: -90, color: '#FFFFFF', align: 'right', format: '{point.y:.1f}', // 一个小数 y: 10, // 从上到下 10 像素 style: { fontSize: '13px', fontFamily: 'Verdana, sans-serif' } }
实例
文件名:highcharts_column_rotated.htm
<html> <head> <title>Highcharts 教程 | 菜鸟教程(runoob.com)</title> <script src="http://apps.bdimg.com/libs/jquery/2.1.4/jquery.min.js"></script> <script src="/try/demo_source/highcharts.js"></script> </head> <body> <div id="container" style="width: 550px; height: 400px; margin: 0 auto"></div> <script language="JavaScript"> $(document).ready(function() { var chart = { type: 'column' }; var title = { text: '2014 年全球最大人口城市排名' }; var subtitle = { text: 'Source: <a href="http://en.wikipedia.org/wiki/List_of_cities_proper_by_population">Wikipedia</a>' }; var xAxis = { type: 'category', labels: { rotation: -45, style: { fontSize: '13px', fontFamily: 'Verdana, sans-serif' } } }; var yAxis ={ min: 0, title: { text: 'Population (millions)' } }; var tooltip = { pointFormat: '2008 年人口: <b>{point.y:.1f} 百万</b>' }; var credits = { enabled: false }; var series= [{ name: 'Population', data: [ ['Shanghai', 23.7], ['Lagos', 16.1], ['Instanbul', 14.2], ['Karachi', 14.0], ['Mumbai', 12.5], ['Moscow', 12.1], ['Sao Paulo', 11.8], ['Beijing', 11.7], ['Guangzhou', 11.1], ['Delhi', 11.1], ['Shenzhen', 10.5], ['Seoul', 10.4], ['Jakarta', 10.0], ['Kinshasa', 9.3], ['Tianjin', 9.3], ['Tokyo', 9.0], ['Cairo', 8.9], ['Dhaka', 8.9], ['Mexico City', 8.9], ['Lima', 8.9] ], dataLabels: { enabled: true, rotation: -90, color: '#FFFFFF', align: 'right', format: '{point.y:.1f}', // one decimal y: 10, // 10 pixels down from the top style: { fontSize: '13px', fontFamily: 'Verdana, sans-serif' } } }]; var json = {}; json.chart = chart; json.title = title; json.subtitle = subtitle; json.xAxis = xAxis; json.yAxis = yAxis; json.tooltip = tooltip; json.credits = credits; json.series = series; $('#container').highcharts(json); }); </script> </body> </html>
以上实例输出结果为: