二分类
二分类是指仅有两个不同类的问题。正如我们在上一章中所做的那样,我们将使用 SciKit Learn 库中的便捷函数make_classification()生成数据集:
X, y = skds.make_classification(n_samples=200,
   n_features=2,
   n_informative=2,
   n_redundant=0,
   n_repeated=0,
   n_classes=2,
   n_clusters_per_class=1)
if (y.ndim == 1):
    y = y.reshape(-1,1)
make_classification()的论据是不言自明的; n_samples是要生成的数据点数,n_features是要生成的特征数,n_classes是类的数量,即 2:
n_samples是要生成的数据点数。我们将其保持在 200 以保持数据集较小。n_features是要生成的特征数量;我们只使用两个特征,因此我们可以将它作为一个简单的问题来理解 TensorFlow 命令。n_classes是类的数量,它是 2,因为它是二分类问题。
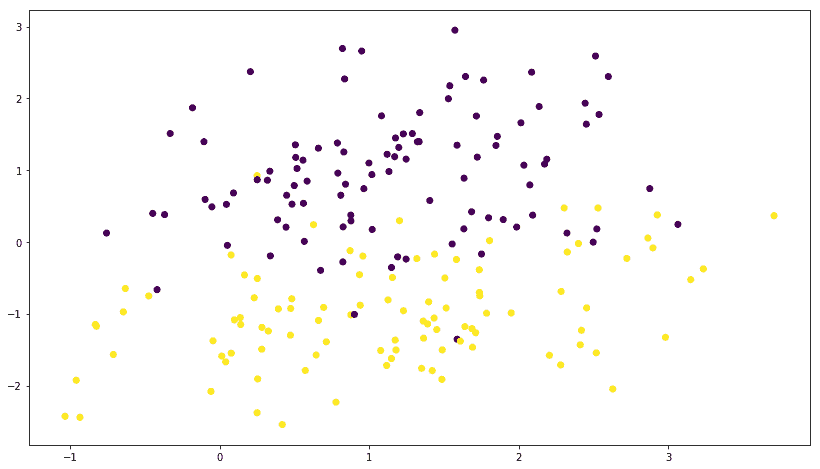
让我们使用以下代码绘制数据:
plt.scatter(X[:,0],X[:,1],marker='o',c=y)
plt.show()
我们得到以下绘图;您可能会得到一个不同的图,因为每次运行数据生成函数时都会随机生成数据:

然后我们使用 NumPy eye函数将y转换为单热编码目标:
print(y[0:5])
y=np.eye(num_outputs)[y]
print(y[0:5])
单热编码目标如下所示:
[1 0 0 1 0]
[[ 0\.  1.]
 [ 1\.  0.]
 [ 1\.  0.]
 [ 0\.  1.]
 [ 1\.  0.]]
将数据划分为训练和测试类别:
X_train, X_test, y_train, y_test = skms.train_test_split(
    X, y, test_size=.4, random_state=42)
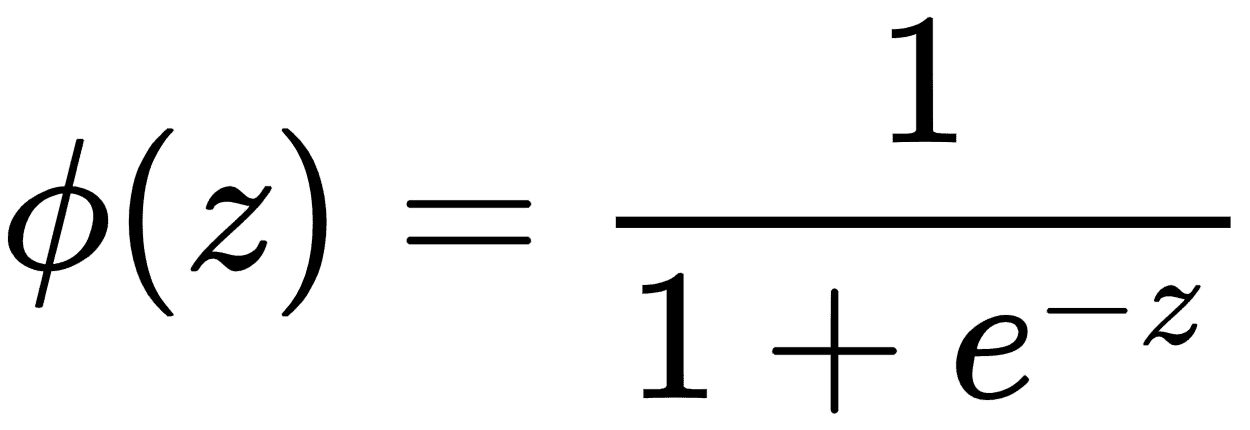
在分类中,我们使用 sigmoid 函数来量化模型的值,使得输出值位于范围[0,1]之间。以下等式表示由φ(z)表示的 S 形函数,其中z是等式w × x + b。损失函数现在变为由J(θ)表示的值,其中θ表示参数。


我们使用以下代码实现新模型和损失函数:
num_outputs = y_train.shape[1]
num_inputs = X_train.shape[1]

learning_rate = 0.001

# input images
x = tf.placeholder(dtype=tf.float32, shape=[None, num_inputs], name="x")
# output labels
y = tf.placeholder(dtype=tf.float32, shape=[None, num_outputs], name="y")

# model paramteres
w = tf.Variable(tf.zeros([num_inputs,num_outputs]), name="w")
b = tf.Variable(tf.zeros([num_outputs]), name="b")
model = tf.nn.sigmoid(tf.matmul(x, w) + b)

loss = tf.reduce_mean(-tf.reduce_sum(
    (y * tf.log(model)) + ((1 - y) * tf.log(1 - model)), axis=1))
optimizer = tf.train.GradientDescentOptimizer(
    learning_rate=learning_rate).minimize(loss)
最后,我们运行我们的分类模型:
num_epochs = 1
with tf.Session() as tfs:
    tf.global_variables_initializer().run()
    for epoch in range(num_epochs):
        tfs.run(optimizer, feed_dict={x: X_train, y: y_train})
        y_pred = tfs.run(tf.argmax(model, 1), feed_dict={x: X_test})
        y_orig = tfs.run(tf.argmax(y, 1), feed_dict={y: y_test})

        preds_check = tf.equal(y_pred, y_orig)
        accuracy_op = tf.reduce_mean(tf.cast(preds_check, tf.float32))
        accuracy_score = tfs.run(accuracy_op)
        print("epoch {0:04d} accuracy={1:.8f}".format(
            epoch, accuracy_score))

        plt.figure(figsize=(14, 4))
        plt.subplot(1, 2, 1)
        plt.scatter(X_test[:, 0], X_test[:, 1], marker='o', c=y_orig)
        plt.title('Original')
        plt.subplot(1, 2, 2)
        plt.scatter(X_test[:, 0], X_test[:, 1], marker='o', c=y_pred)
        plt.title('Predicted')
        plt.show()
我们获得了大约 96%的相当好的准确率,原始和预测的数据图如下所示:

很简约!!现在让我们让我们的问题变得复杂,并尝试预测两个以上的类。